SOL Price Crosses $200 Milestone, What’s Next For Solana?
Solana is gaining bullish momentum above $200. SOL price is still showing positive signs, and it could even surpass the $220 resistance in the near term. SOL price gained bullish momentum and cleared the $200 resistance...

Solana is gaining bullish momentum above $200. SOL price is still showing positive signs, and it could even surpass the $220 resistance in the near term.
- SOL price gained bullish momentum and cleared the $200 resistance against the US Dollar.
- The price is now trading above $200 and the 100 simple moving average (4 hours).
- There is a connecting bullish trend line forming with support at $195 on the 4-hour chart of the SOL/USD pair (data source from Kraken).
- The pair could continue to rally if it clears the $205 and $212 resistance levels.
Solana price remained strong above the $150 level and extended its rally. There was a decent increase above the $165 and $180 levels.
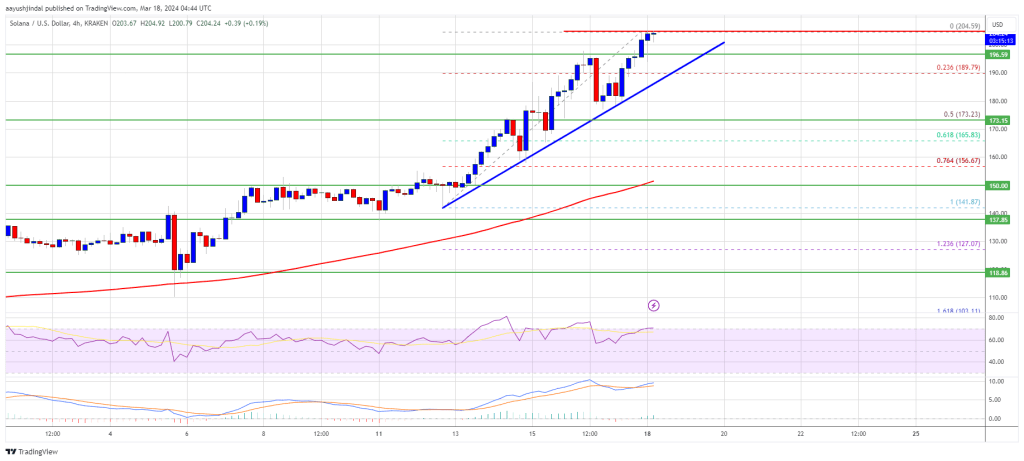
The price is up nearly 20% and there was a move above the $200 level, outperforming Bitcoin and Ethereum. A new multi-month high was formed near $204, and the price is now consolidating gains. It is stable above the 23.6% Fib retracement level of the upward move from the $142 swing low to the $204 high.
There is also a connecting bullish trend line forming with support at $195 on the 4-hour chart of the SOL/USD pair. Solana is now trading above $200 and the 100 simple moving average (4 hours).
Source: SOLUSD on TradingView.com
Immediate resistance is near the $205 level. The next major resistance is near the $212 level. A successful close above the $212 resistance could set the pace for another major increase. The next key resistance is near $220. Any more gains might send the price toward the $232 level.
Are Dips Supported in SOL?If SOL fails to rally above the $205 resistance, it could start a downside correction. Initial support on the downside is near the $195 level and the trend line.
The first major support is near the $175 level or the 50% Fib retracement level of the upward move from the $142 swing low to the $204 high, below which the price could test $165. If there is a close below the $165 support, the price could decline toward the $150 support or the 100 simple moving average (4 hours) in the near term.
Technical Indicators
4-Hours MACD – The MACD for SOL/USD is gaining pace in the bullish zone.
4-Hours RSI (Relative Strength Index) – The RSI for SOL/USD is above the 50 level.
Major Support Levels – $19, and $175.
Major Resistance Levels – $205, $212, and $220.
Original source
Read on NewsBTCRelated market context

XRP Price Analysis: Ripple Token Eyes 10% Gain with Flashing Bullish Pattern and ETF Inflows
XRP price posts 9% moves today from low $1.1 to $1.24, with a prediction that it could go even higher. Two independent tailwinds a...

BTC News Today: Bitcoin Climbs Toward $66K as Trump Reveals US-Iran Peace Deal
The renewed geopolitical optimism helped improve risk sentiment across financial markets, pushing Bitcoin back toward the $66,000...

Bitcoin’s Iran rally faces Japan rate test as it weighs 31-year high
Bitcoin's current relief rally is built on the back of the framework agreement between the US and Iran to halt their conflict and...
XRP Price Prediction: Ripple Jumps 10% as Crypto Total Market Cap Closing $2.4T
XRP price is moving again, and this time, prediction and volume back it up. The token has run 10% in the past 24 hours, pushing th...

Bitcoin Stabilizes Near Key Zone, But Glassnode Warns Capital Flows Remain Weak
Bitcoin’s rebound from the $60,000 area has given bulls something to work with, but Glassnode’s latest market read suggests the re...

Bitcoin Price and Crypto Stocks Surge as Iran Ceasefire, Strategy’s $100M Buy Collide With Fed Week
Bitcoin Magazine Bitcoin Price and Crypto Stocks Surge as Iran Ceasefire, Strategy’s $100M Buy Collide With Fed Week Bitcoin price...