SOL Price Faces Big Move – Can Bulls Send Solana To $120?
Solana is attempting a fresh increase from the $92 zone. SOL price could gain bullish momentum if it manages to clear the $100 and $104 resistance levels. SOL price started a fresh decline from the $106 resistance agains...

Solana is attempting a fresh increase from the $92 zone. SOL price could gain bullish momentum if it manages to clear the $100 and $104 resistance levels.
- SOL price started a fresh decline from the $106 resistance against the US Dollar.
- The price is now trading above $92 and the 100 simple moving average (4 hours).
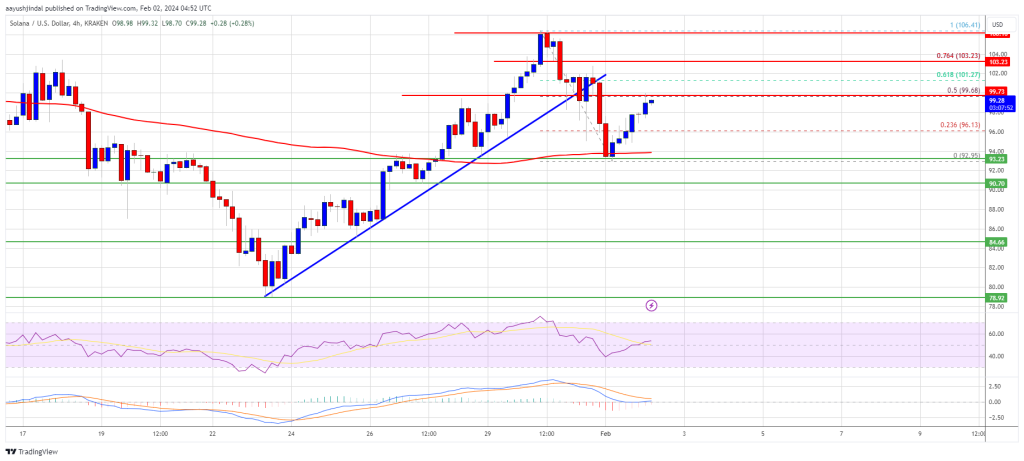
- There was a break below a key bullish trend line with support at $100 on the 4-hour chart of the SOL/USD pair (data source from Kraken).
- The pair could start another increase if it surpasses the $100 and $104 levels.
Solana price started a fresh decline after it struggled to clear the $106 level like Bitcoin at $43,800. There was a clear move below the $102 and $100 support levels.
Besides, there was a break below a key bullish trend line with support at $100 on the 4-hour chart of the SOL/USD pair. However, the bulls were active near the $92 level and the 100 simple moving average (4 hours). The price is now attempting a fresh increase above the $95 level.
The price retested the $100 zone and the 50% Fib retracement level of the downward move from the $106.41 swing high to the $92.95 low. SOL is now trading above $95 and the 100 simple moving average (4 hours).
Source: SOLUSD on TradingView.com
Immediate resistance is near the $100 level. The next major resistance is near the $104 level or the 76.4% Fib retracement level of the downward move from the $106.41 swing high to the $92.95 low. A successful close above the $104 resistance could set the pace for another major increase. The next key resistance is near $112. Any more gains might send the price toward the $120 level.
Another Decline in SOL?If SOL fails to rally above the $100 resistance, it could start another decline. Initial support on the downside is near the $92 level and the 100 simple moving average (4 hours).
The first major support is near the $90 level, below which the price could test $85. If there is a close below the $85 support, the price could decline toward the $78 support in the near term.
Technical Indicators
4-Hours MACD – The MACD for SOL/USD is gaining pace in the bullish zone.
4-Hours RSI (Relative Strength Index) – The RSI for SOL/USD is above the 50 level.
Major Support Levels – $92, and $92.
Major Resistance Levels – $100, $104, and $112.
Original source
Read on NewsBTCRelated market context

Ethereum Price Prediction: ETH is Still Below Its 200 Week SMA, and Tom Lee Buying Spree Might End Soon
Ethereum price is trading above $1,700 after running for 5% today, and even our prediction model is calling for more leg higher. H...

BTC News Today: Bitcoin Climbs Toward $66K as Trump Reveals US-Iran Peace Deal
The renewed geopolitical optimism helped improve risk sentiment across financial markets, pushing Bitcoin back toward the $66,000...

XRP Price Prediction: US-Iran Peace Deal Fuels 13% XRP Surge, Analysts Target $1.94 Retest
The latest move saw XRP price today reclaim the $1.28 level for the first time in nearly two weeks. Market participants pointed to...

Ethereum News: Last Chance to Buy Ethereum Under $2K? ETH USD Powers Up After Hormuz Peace Deal
In the latest Ethereum News, Ethereum ETH Price is trading at $1,739 up 4% in 24 hours, as risk assets catch a bid following the H...

Bitcoin Stabilizes Near Key Zone, But Glassnode Warns Capital Flows Remain Weak
Bitcoin’s rebound from the $60,000 area has given bulls something to work with, but Glassnode’s latest market read suggests the re...

Bitcoin Price and Crypto Stocks Surge as Iran Ceasefire, Strategy’s $100M Buy Collide With Fed Week
Bitcoin Magazine Bitcoin Price and Crypto Stocks Surge as Iran Ceasefire, Strategy’s $100M Buy Collide With Fed Week Bitcoin price...