SOL Price Prediction: Solana Drops But It’s Too Early to Say Bulls Have Given Up
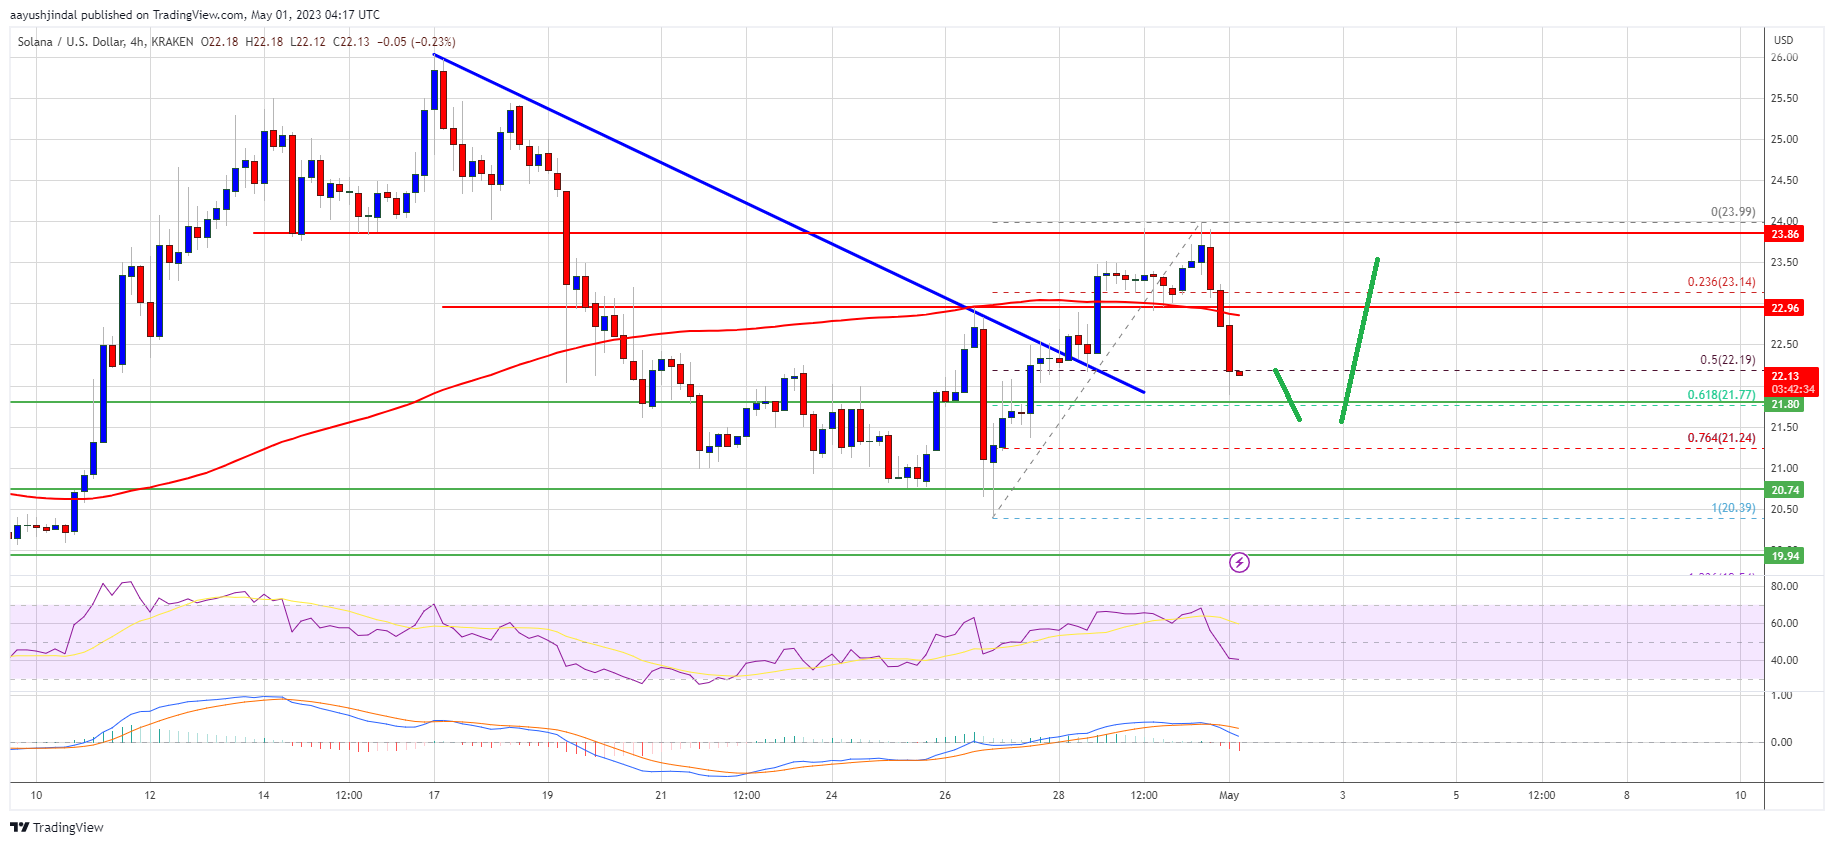
Solana started a downside correction from $24 against the US Dollar. SOL price might start a fresh increase if it stays above the $21.50 support. SOL price is correcting lower from the $24 resistance against the US Dolla...
Archive context
Older archive item. Useful for background and entity history, but not a fresh market-moving signal.

Solana started a downside correction from $24 against the US Dollar. SOL price might start a fresh increase if it stays above the $21.50 support.
- SOL price is correcting lower from the $24 resistance against the US Dollar.
- The price is now trading below $23.50 and the 100 simple moving average (4 hours).
- There was a break above a major bearish trend line with resistance near $22.50 on the 4-hour chart of the SOL/USD pair (data source from Kraken).
- The pair could start a fresh increase if it stays above the $21.50 support.
This past week, Solana’s price formed a base above the $20.50 level. SOL started a fresh increase and was able to clear the $21.50 resistance. There was a break above a major bearish trend line with resistance near $22.50 on the 4-hour chart of the SOL/USD pair.
However, the bears were active near the $24 resistance. A high is formed near $23.99 and the price is now correcting gains, similar to Bitcoin and Ethereum.
SOL declined below the $23.50 and $23.00 levels. There was a drop below the 50% Fib retracement level of the upward move from the $20.39 swing low to the $23.99 high. It is now trading below $23.50 and the 100 simple moving average (4 hours).
Source: SOLUSD on TradingView.com
On the upside, immediate resistance is near the $22.50 level. The next major resistance is near the $23 zone and the 100 simple moving average (4 hours). A close above the $23 level could resend the price toward the $24 resistance zone. Any more gains might send the price toward the $25 level.
More Losses in SOL?If SOL fails to clear the $23 resistance, it could continue to move down. Initial support on the downside is near the $21.75 level or the 61.8% Fib retracement level of the upward move from the $20.39 swing low to the $23.99 high.
The first major support is near the $21.50 level, below which the bears might gain strength. In the stated case, the price may perhaps decline toward the $20.40 support. The next major support is near the $20 level.
Technical Indicators
4-Hours MACD – The MACD for SOL/USD is gaining pace in the bearish zone.
4-Hours RSI (Relative Strength Index) – The RSI for SOL/USD is below the 50 level.
Major Support Levels – $21.75, $21.50, and $20.00.
Major Resistance Levels – $22.50, $23, and $24.
Why this matters
This altcoin story adds another data point to the current market tape and is useful when read alongside nearby source coverage.
Original source
Read on NewsBTCRelated market context

Bitcoin (BTC) Price Prediction: BTC Holds $63K Support—Can Rising Active Addresses Offset Bearish Technical Signals?
Although the BTC price has remained near a key support zone, recent chart signals and Strategy’s sale of a portion of its Bitcoin...

Ethereum (ETH) Price Prediction: ETH Holds Near $1,780 as Bulls Eye $1,860–$1,950, but $1,609 Remains Key Invalidation
Ethereum price is trading near $1,779 after a mixed 24-hour session, according to Brave New Coin data. ETH is down around 0.76% on...

Bitcoin Price Prediction: Peter Brandt Might Dump BTC for Gold
Bitcoin is facing a test, and its price prediction is not helping. So far in 2026, BTC has fallen about 28%, while gold is down ju...

The CLARITY Act Missed Its July 4 Deadline. Is Crypto Screwed?
There is a version of 2026 in which the United States finally settled the question that has defined a decade of crypto litigation...

XRP Price Prediction: Volume and ETF Inflow Send Ripple Token Higher
XRP price pushed above the $1.14 resistance area after buyers stepped in with heavy volume and bullish prediction. The token climb...
USDT Returns to Bitcoin: RGB and UTEXO Enable Private Lightning Settlements
Bitcoin Magazine USDT Returns to Bitcoin: RGB and UTEXO Enable Private Lightning Settlements Tether, the company behind USDT, is p...