SOL Price Prediction: Solana Topside Bias Vulnerable Unless It Surges Past $23
Solana is struggling below the $23 resistance against the US Dollar. SOL price could decline again if there is a clear move below the $20 support. SOL price is showing bearish signs below the $23 barrier against the US D...
Archive context
Older archive item. Useful for background and entity history, but not a fresh market-moving signal.

Solana is struggling below the $23 resistance against the US Dollar. SOL price could decline again if there is a clear move below the $20 support.
- SOL price is showing bearish signs below the $23 barrier against the US Dollar.
- The price is now trading below $22.50 and the 100 simple moving average (4 hours).
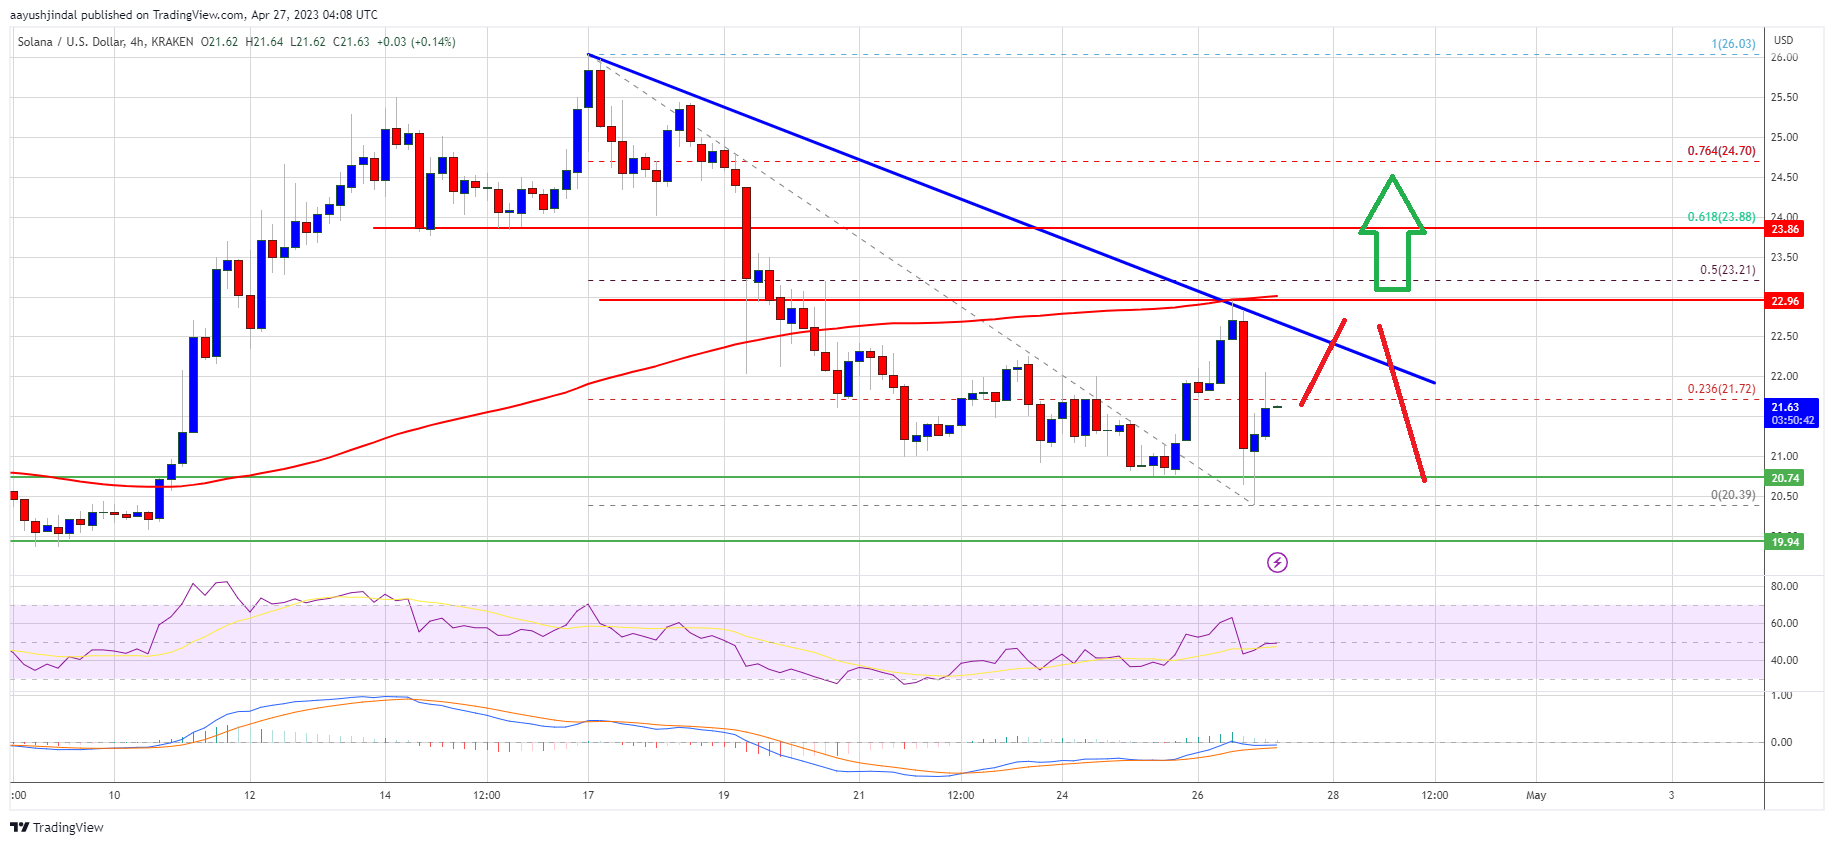
- There is a key bearish trend line forming with resistance near $22.30 on the 4-hour chart of the SOL/USD pair (data source from Kraken).
- The pair could start a decent increase if it clears the trend line and then $23.
This past week, Solana’s price saw a steady decline from well above the $24 level, similar to Bitcoin and Ethereum. SOL declined below the $23 and $22 levels to move into a bearish zone.
It even spiked below the $20.50 support. A low is formed near $20.39 and the price is now consolidating losses. It is trading below $22.50 and the 100 simple moving average (4 hours). There is also a key bearish trend line forming with resistance near $22.30 on the 4-hour chart of the SOL/USD pair.
On the upside, immediate resistance is near the $21.75 level. It is close to the 23.6% Fib retracement level of the downward move from the $26.03 swing high to the $20.39 low.
Source: SOLUSD on TradingView.com
The next major resistance is near the trend line, above which the price could gain bullish momentum and rise toward the $23 resistance or the 50% Fib retracement level of the downward move from the $26.03 swing high to the $20.39 low. Any more gains might send the price toward the $25 level.
Fresh Decline in SOL?If SOL fails to clear the $23 resistance, it could start a fresh decline. Initial support on the downside is near the $21.00 level.
The first major support is near the $20 level, below which the bears might gain strength. In the stated case, the price may perhaps decline toward the $18.80 support in the coming days. The next major support is near the $18 level.
Technical Indicators
4-Hours MACD – The MACD for SOL/USD is losing pace in the bullish zone.
4-Hours RSI (Relative Strength Index) – The RSI for SOL/USD is near the 50 level.
Major Support Levels – $21.00, $20.00, and $18.80.
Major Resistance Levels – $22.30, $23, and $25.
Why this matters
This altcoin story adds another data point to the current market tape and is useful when read alongside nearby source coverage.
Original source
Read on NewsBTCRelated market context

Crypto never closes, but Bitcoin, Ethereum, XRP and Solana now move on Wall Street time
Bitcoin trades nonstop, but a decade of data shows its volatility increasingly follows Wall Street’s clock. A recent study found t...

Jump Firedancer ends support for Frankendancer as Solana’s Alpenglow upgrade nears
The transition to Alpenglow marks a pivotal shift in Solana's consensus mechanism, necessitating validator adaptation for network...

Bitcoin Price Prediction: Can BTC Hold Key Support at $76,000?
Today’s Bitcoin price prediction shows BTC trading at $76,800, down -1.1% on the day, as the market digests a rougher-than-expecte...

XRP Faces Key Levels as Top Holders Reveal Who Controls the Supply
XRP trades at $1.38, falling but still inside its range. Below the surface, a fresh supply audit shows why price feels stuck, and...

Solana’s tokenized Grindr stock nears $31M in trading volume, nearly doubling NYSE figures
Solana's tokenized equity surge highlights blockchain's potential to disrupt traditional markets, though sustainability and access...

DraftKings’ tokenized stock DKNG hits $39M in volume on Solana within three hours
Solana's rise as a dominant platform for tokenized equities challenges traditional finance and other blockchains, reshaping invest...