SOL Price Prediction – Why Solana Could See Sharp Downside Thrust
Solana is moving lower from the $115 resistance. SOL price is showing a few bearish signs and might decline sharply toward the $68 support. SOL price started a fresh decline from the $115 resistance against the US Dollar...

Solana is moving lower from the $115 resistance. SOL price is showing a few bearish signs and might decline sharply toward the $68 support.
- SOL price started a fresh decline from the $115 resistance against the US Dollar.
- The price is now trading below $100 and the 100 simple moving average (4 hours).
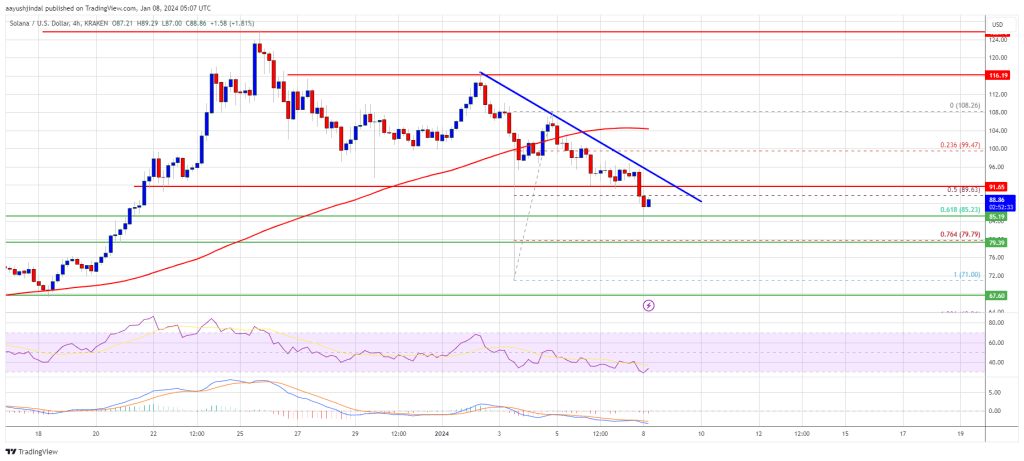
- There is a key bearish trend line forming with resistance near $92 on the 4-hour chart of the SOL/USD pair (data source from Kraken).
- The pair could continue to move down toward the $80 support or even $68.
After a steady increase, Solana bulls struggled to clear the $115 resistance. SOL price formed a short-term top and started a fresh decline below the $105 support.
There was a steady decline below the $100 pivot level. The bears pushed the price below the 50% Fib retracement level of the upward move from the $71 swing low to the $108 high. The price is now showing a few bearish signs from the $115 resistance zone, like Bitcoin and Ethereum.
SOL is now trading below $95 and the 100 simple moving average (4 hours). There is also a key bearish trend line forming with resistance near $92 on the 4-hour chart of the SOL/USD pair.
Source: SOLUSD on TradingView.com
If there is a fresh increase, immediate resistance is near the $92 level and the trend line. The first major resistance is near the $100 level or the 100 simple moving average (4 hours). The main resistance is now near $105. A successful close above the $105 resistance could set the pace for another major rally. The next key resistance is near $115. Any more gains might send the price toward the $125 level.
More Losses in SOL?If SOL fails to rally above the $92 resistance, it could continue to move down. Initial support on the downside is near the $80 level.
The first major support is near the $72 level, below which the price could test $68. If there is a close below the $68 support, the price could decline toward the $50 support in the near term.
Technical Indicators
4-Hours MACD – The MACD for SOL/USD is gaining pace in the bearish zone.
4-Hours RSI (Relative Strength Index) – The RSI for SOL/USD is below the 50 level.
Major Support Levels – $80, and $68.
Major Resistance Levels – $92, $100, and $105.
Original source
Read on NewsBTCRelated market context

Ethereum Price Prediction: ETH is Still Below Its 200 Week SMA, and Tom Lee Buying Spree Might End Soon
Ethereum price is trading above $1,700 after running for 5% today, and even our prediction model is calling for more leg higher. H...

BTC News Today: Bitcoin Climbs Toward $66K as Trump Reveals US-Iran Peace Deal
The renewed geopolitical optimism helped improve risk sentiment across financial markets, pushing Bitcoin back toward the $66,000...

Ethereum News: Last Chance to Buy Ethereum Under $2K? ETH USD Powers Up After Hormuz Peace Deal
In the latest Ethereum News, Ethereum ETH Price is trading at $1,739 up 4% in 24 hours, as risk assets catch a bid following the H...

Bitcoin Price Prediction: Bank of Japan Rate Hike and Piling Yen Shorts Threaten BTC
Bitcoin price is back above $65,000, gaining more than $3,000 in a day, although Washington helps, news from the other side of the...

XRP Price Prediction: US-Iran Peace Deal Fuels 13% XRP Surge, Analysts Target $1.94 Retest
The latest move saw XRP price today reclaim the $1.28 level for the first time in nearly two weeks. Market participants pointed to...

XRP Price Analysis: Ripple Token Eyes 10% Gain with Flashing Bullish Pattern and ETF Inflows
XRP price posts 9% moves today from low $1.1 to $1.24, with a prediction that it could go even higher. Two independent tailwinds a...