SOL Price Reaches Make-or-Break Levels – Can Solana Pump Again?
Solana is moving lower from the $120 resistance. SOL price is showing a few bearish signs and might decline sharply toward the $80 support. SOL price started a fresh decline from the $120 resistance against the US Dollar...

Solana is moving lower from the $120 resistance. SOL price is showing a few bearish signs and might decline sharply toward the $80 support.
- SOL price started a fresh decline from the $120 resistance against the US Dollar.
- The price is now trading below $102 and the 100 simple moving average (4 hours).
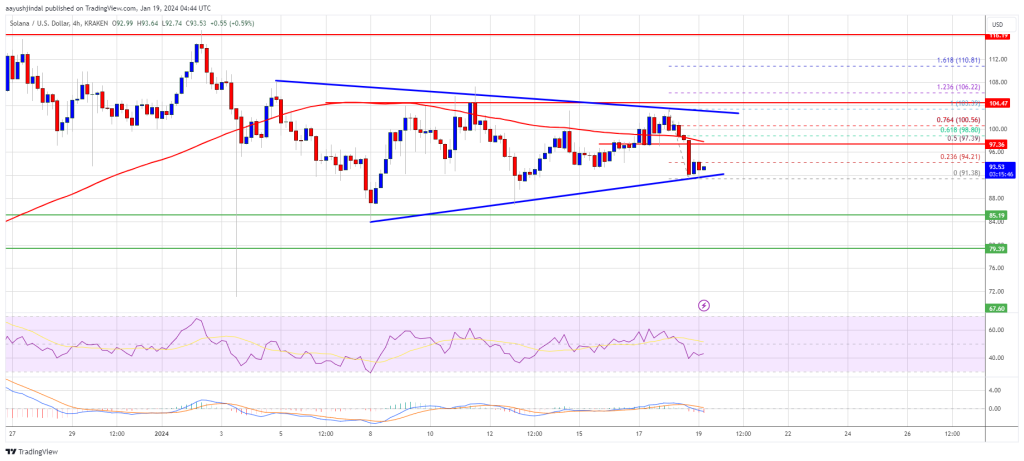
- There is a key contracting triangle forming with resistance near $102 on the 4-hour chart of the SOL/USD pair (data source from Kraken).
- The pair could continue to move down toward the $85 support or even $80.
After a steady increase, Solana bulls struggled to clear the $120 resistance. SOL price formed a short-term top and started a fresh decline below the $112 support, like Bitcoin and Ethereum.
There was a steady decline below the $105 level. The bears pushed the price below the $100 level. It tested the $91.50 support. A low is formed near $91.38, and the price is now consolidating losses. There is also a key contracting triangle forming with resistance near $102 on the 4-hour chart of the SOL/USD pair.
SOL is now trading below $102 and the 100 simple moving average (4 hours). Immediate resistance is near the $97.40 level. It is close to the 50% Fib retracement level of the downward move from the $103.39 swing high to the $91.38 low.
The first major resistance is near the $100 level or the 76.4% Fib retracement level of the downward move from the $103.39 swing high to the $91.38 low.
Source: SOLUSD on TradingView.com
The main resistance is now near $102. A successful close above the $102 resistance could set the pace for another major rally. The next key resistance is near $112. Any more gains might send the price toward the $120 level.
More Losses in SOL?If SOL fails to rally above the $102 resistance, it could continue to move down. Initial support on the downside is near the $92.00 level.
The first major support is near the $85.20 level, below which the price could test $80. If there is a close below the $68 support, the price could decline toward the $74.50 support in the near term.
Technical Indicators
4-Hours MACD – The MACD for SOL/USD is gaining pace in the bearish zone.
4-Hours RSI (Relative Strength Index) – The RSI for SOL/USD is below the 50 level.
Major Support Levels – $85, and $80.
Major Resistance Levels – $97.40, $102, and $112.
Original source
Read on NewsBTCRelated market context

BTC News Today: Bitcoin Climbs Toward $66K as Trump Reveals US-Iran Peace Deal
The renewed geopolitical optimism helped improve risk sentiment across financial markets, pushing Bitcoin back toward the $66,000...

XRP Price Prediction: US-Iran Peace Deal Fuels 13% XRP Surge, Analysts Target $1.94 Retest
The latest move saw XRP price today reclaim the $1.28 level for the first time in nearly two weeks. Market participants pointed to...
Forward Industries moves to consolidate Solana treasury sector as SOL prices crater
Forward Industries' consolidation strategy could either amplify shareholder gains if SOL rebounds or exacerbate losses amid furthe...
Lummis Links Bitcoin to $39.2T US Debt Crisis as CLARITY Act Nears Senate Floor
Senator Cynthia Lummis publicly tied Bitcoin to America’s $39.2 trillion national debt crisis on June 15, positioning the asset as...

Ethereum Research Proposal Targets Post-Quantum Wallet Security At Low Gas Cost
A new Ethereum Research proposal is putting post-quantum wallet security back in focus, outlining a practical way to verify quantu...

Bitcoin Stabilizes Near Key Zone, But Glassnode Warns Capital Flows Remain Weak
Bitcoin’s rebound from the $60,000 area has given bulls something to work with, but Glassnode’s latest market read suggests the re...