SOL Price Regains Strength, Can Solana Reclaim $150 and Continue Higher?
Solana started a fresh increase above the $142 resistance. SOL price is up nearly 8% and might continue to rise if it clears the $150 resistance. SOL price recovered higher and tested the $150 resistance against the US D...
Archive context
Older archive item. Useful for background and entity history, but not a fresh market-moving signal.

Solana started a fresh increase above the $142 resistance. SOL price is up nearly 8% and might continue to rise if it clears the $150 resistance.
- SOL price recovered higher and tested the $150 resistance against the US Dollar.
- The price is now trading above $1452 and the 100 simple moving average (4 hours).
- There was a break above a key bearish trend line with resistance at $144 on the 4-hour chart of the SOL/USD pair (data source from Kraken).
- The pair could clear the $150 resistance unless it fails to stay above $146.
Solana price formed a support base near the $138 level and started a fresh increase. SOL outperformed Bitcoin and Ethereum and moved into a positive zone above the $144 level.
There was a break above a key bearish trend line with resistance at $144 on the 4-hour chart of the SOL/USD pair. The pair even cleared the 50% Fib retracement level of the downward wave from the $154.40 swing high to the $138.00 low.
However, the bears are active near the key hurdle at $150. Solana is now trading above $145 and the 100 simple moving average (4 hours). Immediate resistance is near the $150 level or the 76.4% Fib retracement level of the downward wave from the $154.40 swing high to the $138.00 low.
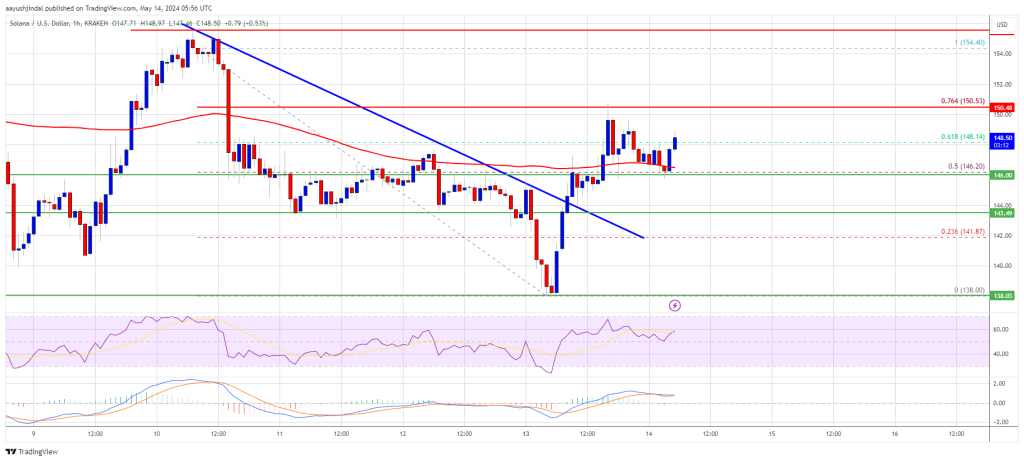
The next major resistance is near the $155 level. A successful close above the $155 resistance could set the pace for another major increase. The next key resistance is near $162. Any more gains might send the price toward the $175 level.
Another Decline in SOL?If SOL fails to rally above the $150 resistance, it could start another decline. Initial support on the downside is near the $146 level and the 100 simple moving average (4 hours).
The first major support is near the $142 level, below which the price could test $138. If there is a close below the $138 support, the price could decline toward the $125 support in the near term.
Technical Indicators
4-Hours MACD – The MACD for SOL/USD is gaining pace in the bullish zone.
4-Hours RSI (Relative Strength Index) – The RSI for SOL/USD is above the 50 level.
Major Support Levels – $146, and $142.
Major Resistance Levels – $150, $155, and $162.
Why this matters
This altcoin story adds another data point to the current market tape and is useful when read alongside nearby source coverage.
Original source
Read on NewsBTCRelated market context
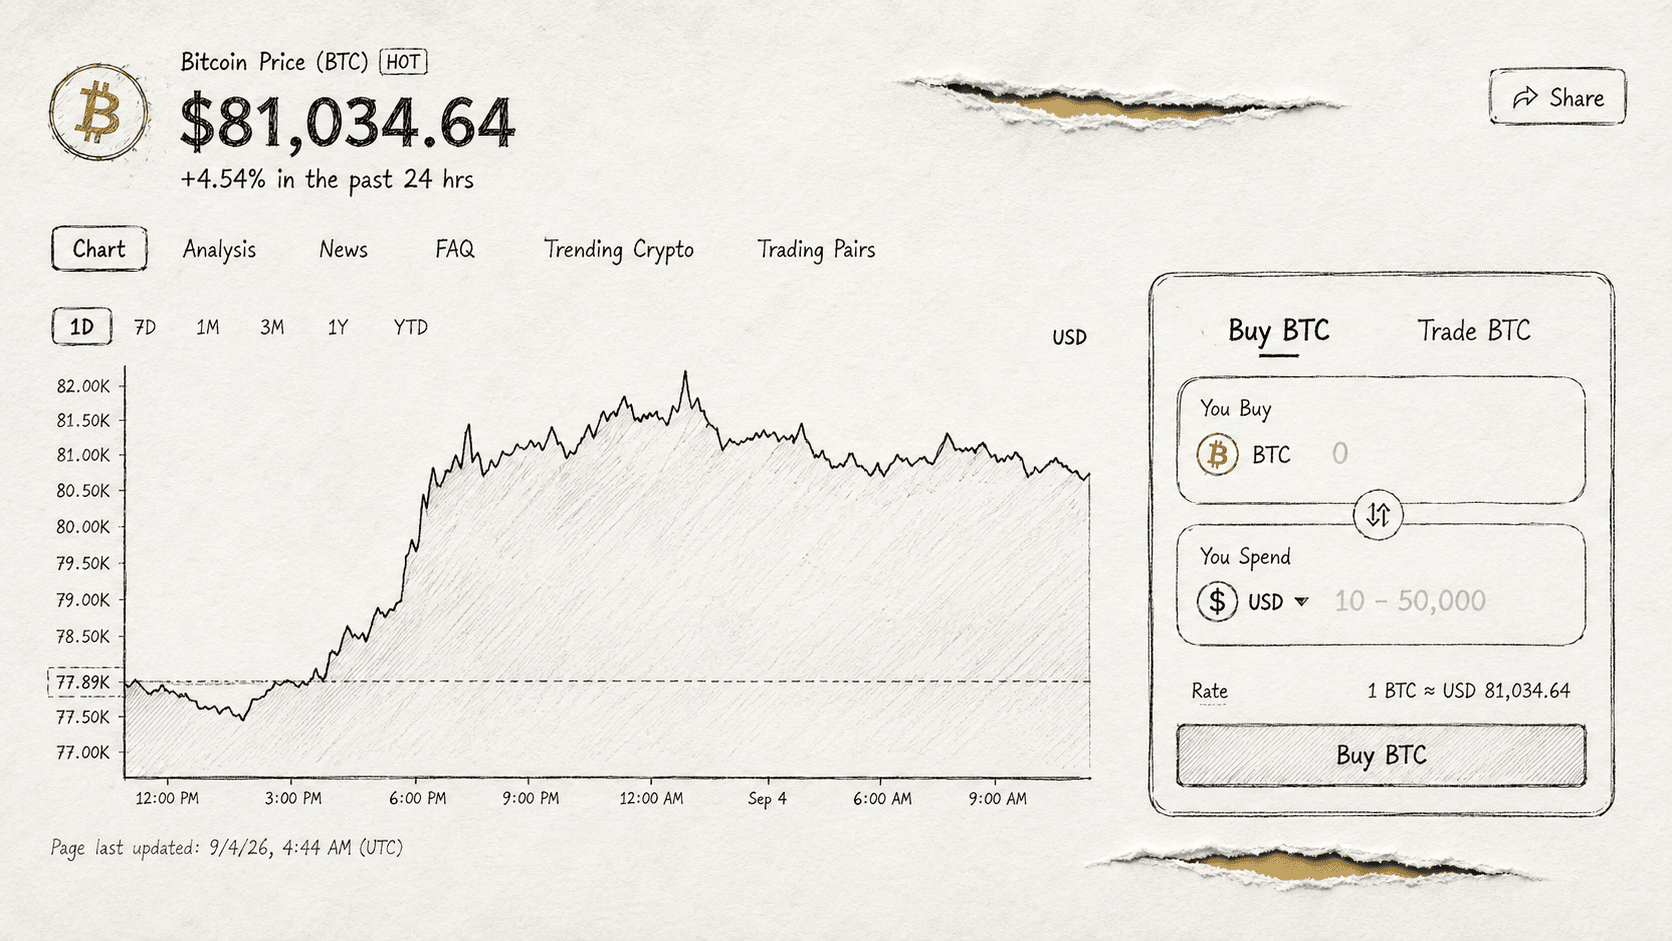
Bitcoin Back Above $80,000 as Traders Cut September Fed Hike Odds to a Coin Flip
Bitcoin has traded as high as $82,000 in the past 24 hours, before shedding some of its gains to most recently to trade at $80,718...
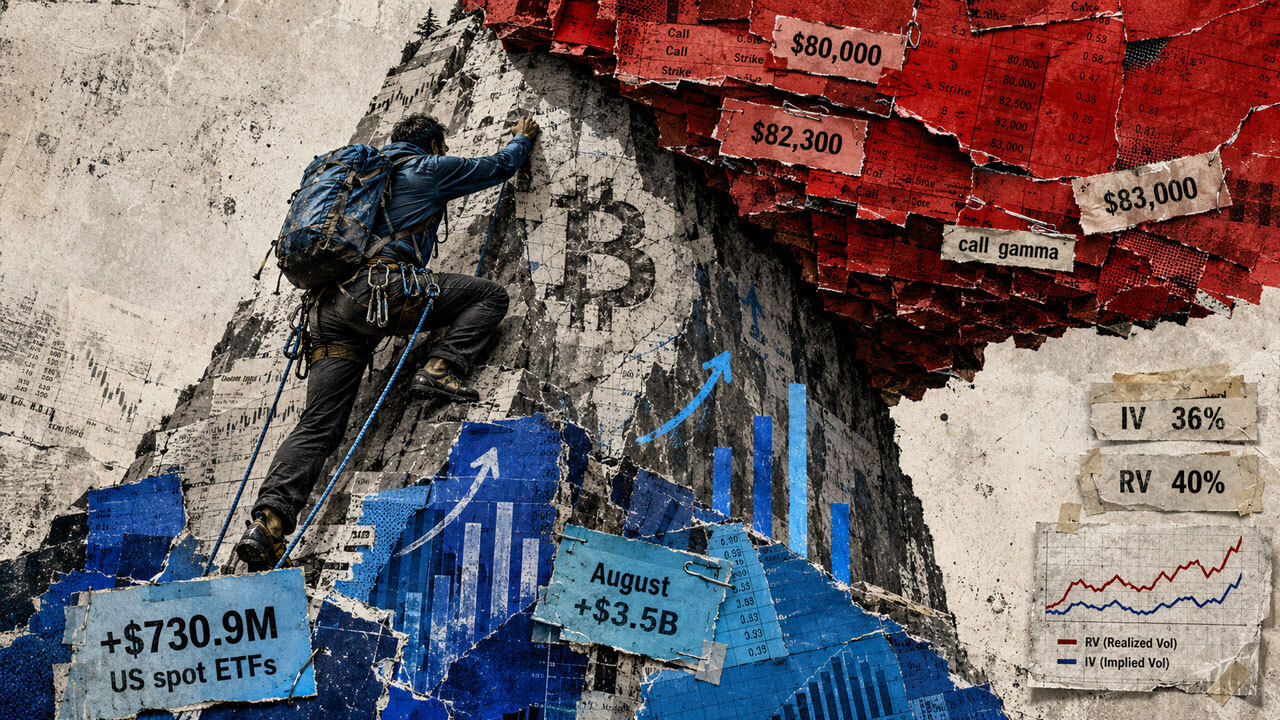
Bitcoin’s rally over $81,000 is finding real buyers, but options traders still aren’t pricing a clean breakout
Bitcoin accelerated above $81,000 on Thursday as easing rate fears and fresh institutional demand lifted the broader crypto market...

XRP News: Ripple Rallies on Fed Dovish Tone, $10 Dream Returns
XRP is back at $1.45, having a violent 6% rally on the Fed news, so is the whole crypto market. The run is strengthening the bigge...

Crypto market cap surges $135B in 24 hours, Bitcoin nears $81K
The surge in crypto market cap may boost investor confidence, potentially driving further asset appreciation and influencing futur...

Arthur Hayes calls EUR/JPY prices crypto’s smoke alarm, but the Fed’s plumbing still shows no fire
Arthur Hayes has a new market alarm for crypto traders: EUR/JPY. The pair has started to fall, yet the Federal Reserve channels th...

Wall Street just poured nearly $900 million into Bitcoin and Ethereum ETFs
Bitcoin and Ethereum exchange-traded funds (ETFs) drew nearly $900 million as both cryptocurrencies pushed through closely watched...