SOL Price Surges 10% As Solana Bulls Aim New High Above $125
Solana is up over 10% and gaining pace above $105. SOL price seems to be setting up for an upside break above the $125 resistance zone. SOL price started a fresh rally above the $100 resistance against the US Dollar. The...

Solana is up over 10% and gaining pace above $105. SOL price seems to be setting up for an upside break above the $125 resistance zone.
- SOL price started a fresh rally above the $100 resistance against the US Dollar.
- The price is now trading above $105 and the 100 simple moving average (4 hours).
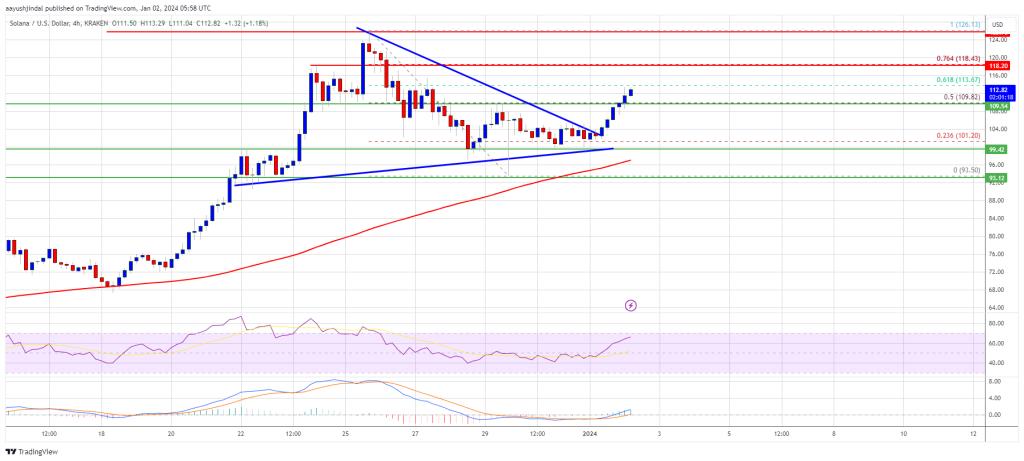
- There was a break above a key contracting triangle with resistance near $104 on the 4-hour chart of the SOL/USD pair (data source from Kraken).
- The pair could continue to rally if there is a clear move above the $118 resistance.
After a downside correction, Solana found support near the $93.50 level. SOL formed a base and recently started a fresh increase above the $100 resistance.
It is up over 10% today, outperforming Bitcoin and Ethereum. There was a move above the 50% Fib retracement level of the downward move from the $126.13 swing high to the $93.50 low. Besides, there was a break above a key contracting triangle with resistance near $104 on the 4-hour chart of the SOL/USD pair.
SOL is now trading above $105 and the 100 simple moving average (4 hours). On the upside, immediate resistance is near the $114 level. The first major resistance is near the $118 level or the 76.4% Fib retracement level of the downward move from the $126.13 swing high to the $93.50 low.
Source: SOLUSD on TradingView.com
The main resistance is now near $125. A successful close above the $125 resistance could set the pace for another major rally. The next key resistance is near $138. Any more gains might send the price toward the $145 level.
Another Drop in SOL?If SOL fails to rally above the $118 resistance, it could start a downside correction. Initial support on the downside is near the $108 level.
The first major support is near the $100 level or the 100 simple moving average (4 hours), below which the price could test $94. If there is a close below the $94 support, the price could decline toward the $80 support in the near term.
Technical Indicators
4-Hours MACD – The MACD for SOL/USD is gaining pace in the bullish zone.
4-Hours RSI (Relative Strength Index) – The RSI for SOL/USD is above the 50 level.
Major Support Levels – $108, and $100.
Major Resistance Levels – $118, $125, and $138.
Original source
Read on NewsBTCRelated market context

Bitcoin’s Iran rally faces Japan rate test as it weighs 31-year high
Bitcoin's current relief rally is built on the back of the framework agreement between the US and Iran to halt their conflict and...

Emerging-market stocks near record high as tech gains boost rally, leaving crypto behind
The tech-driven rally in emerging markets highlights a shift in capital allocation, potentially sidelining crypto as investors cha...

Bitcoin Stabilizes Near Key Zone, But Glassnode Warns Capital Flows Remain Weak
Bitcoin’s rebound from the $60,000 area has given bulls something to work with, but Glassnode’s latest market read suggests the re...

Bitcoin Price and Crypto Stocks Surge as Iran Ceasefire, Strategy’s $100M Buy Collide With Fed Week
Bitcoin Magazine Bitcoin Price and Crypto Stocks Surge as Iran Ceasefire, Strategy’s $100M Buy Collide With Fed Week Bitcoin price...
XRP Price Prediction: Ripple Jumps 10% as Crypto Total Market Cap Closing $2.4T
XRP price is moving again, and this time, prediction and volume back it up. The token has run 10% in the past 24 hours, pushing th...

Bitcoin and Ethereum Blockchain Activity Surges as Network Metrics Hit New Highs
Bitcoin and Ethereum on-chain activity surges with rising transaction volumes and active addresses, driven by market rally and ins...