SOL Price Surges To $115 – Why Solana Could Rally Another 10%
Solana is gaining bullish momentum above $110. SOL price is surging, and the bulls could soon aim for a move above the $120 level. SOL price started a fresh increase from the $95.00 support against the US Dollar. The pri...

Solana is gaining bullish momentum above $110. SOL price is surging, and the bulls could soon aim for a move above the $120 level.
- SOL price started a fresh increase from the $95.00 support against the US Dollar.
- The price is now trading above $105 and the 100 simple moving average (4 hours).
- There is a key bullish trend line forming with support at $109.20 on the 4-hour chart of the SOL/USD pair (data source from Kraken).
- The pair could continue to rally if it clears the $115 and $118 resistance levels.
Solana price formed a base above the $94.00 support zone and recently started a fresh increase. There was a decent increase above the $98 and $100 levels.
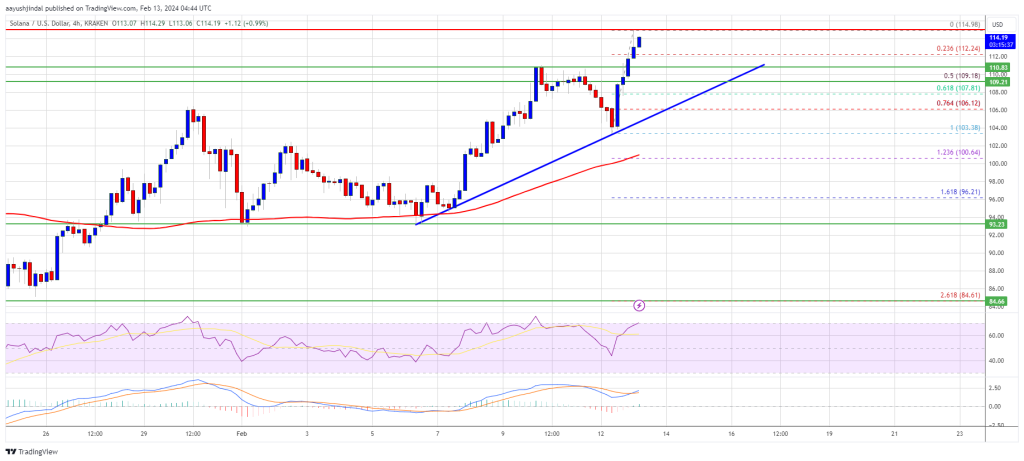
The price is up nearly 10% and there was a move above the $110 level, outperforming Bitcoin and Ethereum. The bulls pushed the price close to $115. A high is formed near $114.98 and the price is showing no signs of upside exhaustion.
It is holding gains above the 23.6% Fib retracement level of the recent wave from the $103.38 swing low to the $114.98 high. Solana is now trading above $110 and the 100 simple moving average (4 hours).
There is also a key bullish trend line forming with support at $109.20 on the 4-hour chart of the SOL/USD pair. The trend line is near the 50% Fib retracement level of the recent wave from the $103.38 swing low to the $114.98 high.
Source: SOLUSD on TradingView.com
Immediate resistance is near the $115 level. The next major resistance is near the $118 level. A successful close above the $118 resistance could set the pace for another major increase. The next key resistance is near $125. Any more gains might send the price toward the $132 level.
Are Dips Supported in SOL?If SOL fails to rally above the $115 resistance, it could start a downside correction. Initial support on the downside is near the $112.20 level.
The first major support is near the $109.20 level and the trend line, below which the price could test $105. If there is a close below the $105 support, the price could decline toward the $100 support in the near term.
Technical Indicators
4-Hours MACD – The MACD for SOL/USD is gaining pace in the bullish zone.
4-Hours RSI (Relative Strength Index) – The RSI for SOL/USD is above the 50 level.
Major Support Levels – $102.20, and $109.20.
Major Resistance Levels – $115, $118, and $125.
Original source
Read on NewsBTCRelated market context

BTC News Today: Bitcoin Climbs Toward $66K as Trump Reveals US-Iran Peace Deal
The renewed geopolitical optimism helped improve risk sentiment across financial markets, pushing Bitcoin back toward the $66,000...

Bitcoin’s Iran rally faces Japan rate test as it weighs 31-year high
Bitcoin's current relief rally is built on the back of the framework agreement between the US and Iran to halt their conflict and...

Bitcoin Stabilizes Near Key Zone, But Glassnode Warns Capital Flows Remain Weak
Bitcoin’s rebound from the $60,000 area has given bulls something to work with, but Glassnode’s latest market read suggests the re...
XRP Price Prediction: Ripple Jumps 10% as Crypto Total Market Cap Closing $2.4T
XRP price is moving again, and this time, prediction and volume back it up. The token has run 10% in the past 24 hours, pushing th...
Lummis Links Bitcoin to $39.2T US Debt Crisis as CLARITY Act Nears Senate Floor
Senator Cynthia Lummis publicly tied Bitcoin to America’s $39.2 trillion national debt crisis on June 15, positioning the asset as...
Crypto News, June 16: US-Iran Deal Oddity, FTX Claim Day, ETH USD Season Drawing Closer
We start today’s crypto news with a few oddities in the US-Iran deal as it closed faster than most expected, while the bombing tal...