SOL Price Topside Bias Vulnerable If Solana Continues To Struggle Below $170
Solana attempted a recovery wave above the $140 level. SOL price is now struggling to clear the $160 and $170 resistance levels. SOL price recovered higher and tested the $160 resistance against the US Dollar. The price...

Solana attempted a recovery wave above the $140 level. SOL price is now struggling to clear the $160 and $170 resistance levels.
- SOL price recovered higher and tested the $160 resistance against the US Dollar.
- The price is now trading below $160 and the 100 simple moving average (4 hours).
- There is a key bullish trend line forming with support at $146 on the 4-hour chart of the SOL/USD pair (data source from Kraken).
- The pair could start another decline if it stays below $160 and $170 for a long time.
Solana price started a major decline below the $170 and $160 support levels. SOL tested the $115 zone and recently started an upside correction, like Bitcoin and Ethereum.
There was a decent increase above the $130 and $140 levels. The price climbed above the 23.6% Fib retracement level of the downward wave from the $205 swing high to the $115 low. It even spiked above the $155 zone and the 100 simple moving average (4 hours).
However, the bears are active near the $160 zone and the 50% Fib retracement level of the downward wave from the $205 swing high to the $115 low. The price struggled and corrected gains.
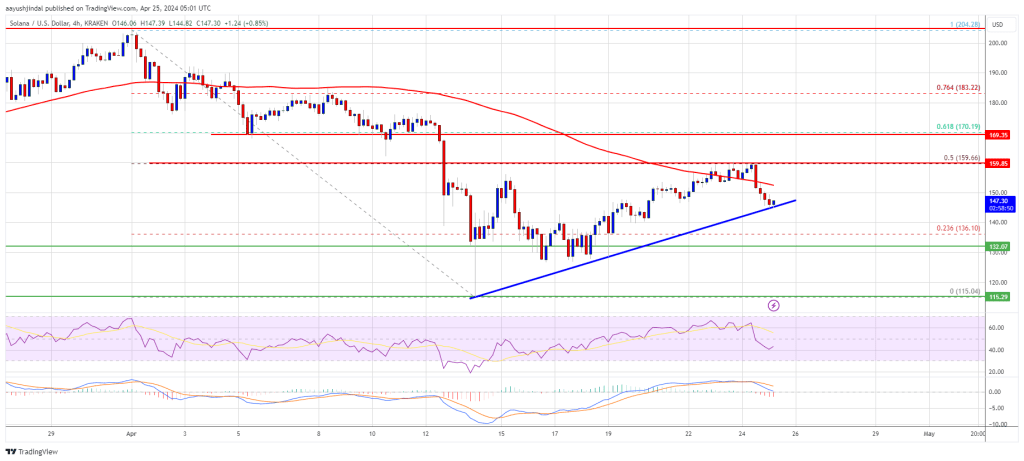
Source: SOLUSD on TradingView.com
Solana is now trading below $160 and the 100 simple moving average (4 hours). There is also a key bullish trend line forming with support at $146 on the 4-hour chart of the SOL/USD pair. Immediate resistance is near the $155 level. The next major resistance is near the $160 level. A successful close above the $160 resistance could set the pace for another major increase. The next key resistance is near $170. Any more gains might send the price toward the $188 level.
Another Decline in SOL?If SOL fails to rally above the $160 resistance, it could start another decline. Initial support on the downside is near the $145 level and the trend line.
The first major support is near the $132 level, below which the price could test $120. If there is a close below the $120 support, the price could decline toward the $100 support in the near term.
Technical Indicators
4-Hours MACD – The MACD for SOL/USD is gaining pace in the bearish zone.
4-Hours RSI (Relative Strength Index) – The RSI for SOL/USD is below the 50 level.
Major Support Levels – $146, and $132.
Major Resistance Levels – $155, $160, and $170.
Original source
Read on NewsBTCRelated market context

XRP just beat Ethereum, Solana and others in 90-Day RWA flows as traders pile back into the token
The XRP Ledger (XRPL) drew more new tokenized real-world asset capital than Ethereum, Solana, and other major blockchains over the...

BTC News Today: Bitcoin Climbs Toward $66K as Trump Reveals US-Iran Peace Deal
The renewed geopolitical optimism helped improve risk sentiment across financial markets, pushing Bitcoin back toward the $66,000...

XRP Price Prediction: US-Iran Peace Deal Fuels 13% XRP Surge, Analysts Target $1.94 Retest
The latest move saw XRP price today reclaim the $1.28 level for the first time in nearly two weeks. Market participants pointed to...

You Will Not Like Where Google Gemini AI Predicts Bitcoin Price Going in 2026
The headline is deliberately provocative, and once you read the actual prediction, you understand why. Google Gemini AI is not pre...

Bitcoin Stabilizes Near Key Zone, But Glassnode Warns Capital Flows Remain Weak
Bitcoin’s rebound from the $60,000 area has given bulls something to work with, but Glassnode’s latest market read suggests the re...

Bitcoin Price and Crypto Stocks Surge as Iran Ceasefire, Strategy’s $100M Buy Collide With Fed Week
Bitcoin Magazine Bitcoin Price and Crypto Stocks Surge as Iran Ceasefire, Strategy’s $100M Buy Collide With Fed Week Bitcoin price...