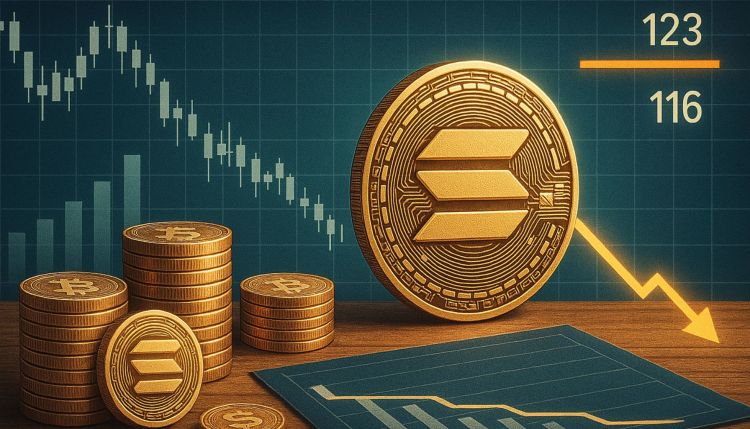
Solana Analyst Sees $123 And $116 As Mid-Zone Support Levels – Here’s Why
Solana is currently testing a critical demand zone near the $150 level after enduring weeks of persistent selling pressure and a broader shift in market sentiment. The asset is now trading roughly 20% below its May high...
Archive context
Older archive item. Useful for background and entity history, but not a fresh market-moving signal.
Solana is currently testing a critical demand zone near the $150 level after enduring weeks of persistent selling pressure and a broader shift in market sentiment. The asset is now trading roughly 20% below its May high of $185, with recent attempts at recovery facing strong resistance. Despite holding above major support for now, the overall structure suggests that downside risk remains if market conditions don’t improve soon.
Top analyst Efloud shared a technical analysis on X, highlighting the importance of tracking Solana’s response to broader Bitcoin dynamics. He noted that if Bitcoin (BTC) continues to consolidate sideways while Bitcoin dominance (BTC.D) rises, altcoins like SOL may struggle. In that case, Solana could continue retracing to find stronger support at mid-zones, particularly around the $123 and $116 levels.
These price zones have previously acted as solid support/resistance areas and could serve as key inflection points should bearish momentum persist. A breakdown toward these targets would likely coincide with increasing BTC.D and continued investor caution in the altcoin market. Until then, SOL remains vulnerable within a fragile technical structure, and traders will closely watch for either a rebound or deeper correction in the coming days.
Solana Holds Key Support As Analysts Eye Bullish ScenariosSolana is currently trading about 50% down from its all-time highs, with the explosive momentum seen at the end of 2024 now replaced by more subdued price action. The asset’s underperformance has left investors cautious, but many analysts remain optimistic about Solana’s potential once a new altcoin rally begins. For now, the focus is on holding critical demand zones that could determine whether SOL is gearing up for a recovery or further downside.
According to Efloud, if Bitcoin continues consolidating sideways while Bitcoin dominance rises, Solana may find support at several mid-zones, particularly around $123 and $116. The $140 region has historically acted as a strong support/resistance flip, and a deviation around this level—losing it briefly before regaining it with strength—could present a short-term buying opportunity.
Efloud notes that this scenario doesn’t necessarily imply that SOL must drop to those levels, but current market conditions—aside from Bitcoin—lack strong pair structures. If SOL can decisively break above the $168 resistance, a new leg upward could be triggered, with $230 potentially acting as the next major resistance zone.
On the SOL/BTC pair, Efloud is watching for a reclaim of the 0.0015 level or a pullback toward 0.00115 for confirmation. Another key support sits at 0.000988 sats.
Despite the current cooling, the structure may still offer solid opportunities for new entrants. If these levels hold and macro conditions improve, SOL could be setting the stage for a sustainable rally, ultimately leading to new all-time highs.
Weekly Chart Analysis – Holding the Line Near Key SupportSolana is currently trading at $148.33 on the weekly timeframe, showing a 3% decline over the past seven days. The price has dropped roughly 20% from its May high of around $185 and is now testing the critical $140–$150 support zone. This level has repeatedly acted as a pivot point in the past and could define SOL’s short-term trajectory.
The chart shows that Solana has been unable to reclaim the 50-week moving average (currently near $170), which now acts as key resistance. A decisive weekly close above this level would open the door for a bullish continuation toward $185 and possibly $200. However, failure to hold above the 100-week moving average around $132 could lead to further downside pressure, with $123 and $116 as the next demand zones to watch—levels identified by analyst Efloud in his mid-zone scenario.
Volume has declined steadily over the past three weeks, signaling reduced participation, but also suggesting that aggressive selling is fading. If bulls manage to reclaim $160 with conviction, the structure remains favorable. For now, SOL remains in a consolidation phase, awaiting either a breakout or further correction as broader crypto market conditions unfold.
Featured image from Dall-E, chart from TradingView
Why this matters
This altcoin story adds another data point to the current market tape and is useful when read alongside nearby source coverage.
Original source
Read on NewsBTCRelated market context

Bitcoin (BTC) Price Prediction: BTC Holds $63K Support—Can Rising Active Addresses Offset Bearish Technical Signals?
Although the BTC price has remained near a key support zone, recent chart signals and Strategy’s sale of a portion of its Bitcoin...

Ethereum (ETH) Price Prediction: ETH Holds Near $1,780 as Bulls Eye $1,860–$1,950, but $1,609 Remains Key Invalidation
Ethereum price is trading near $1,779 after a mixed 24-hour session, according to Brave New Coin data. ETH is down around 0.76% on...

XRP Price Prediction: Volume and ETF Inflow Send Ripple Token Higher
XRP price pushed above the $1.14 resistance area after buyers stepped in with heavy volume and bullish prediction. The token climb...

Ether leads crypto's hold above key levels as bitcoin steadies over $63,000
A stalling rebound in AI and chip stocks and a stronger dollar kept the mood cautious as the second half gets underway.

IPO volume hits levels last seen in 1929 and 2000, and crypto markets are building the on-ramp
The surge in IPOs and crypto's role in facilitating access could signal heightened market volatility and regulatory challenges ahe...
Solana News: Solana Hits $5.77B Tokenized Asset Volume in Q2 2026 All-Time High
Solana News: SOL closed Q2 2026 with $5.77 billion in tokenized asset spot volume, a quarterly all-time high confirmed by data ana...