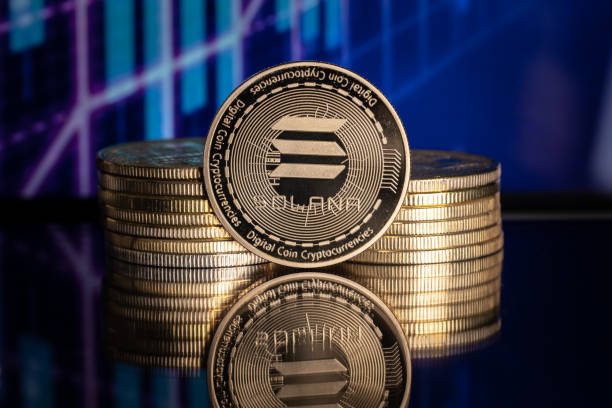
Solana Forms Bullish Flag On Daily Chart — Breakout Imminent?
Solana is displaying signs of strength as it trades with a key chart pattern, which indicates that the altcoin is preparing for a solid move. The price has been holding steady, forming lower highs and higher lows within...
Archive context
Older archive item. Useful for background and entity history, but not a fresh market-moving signal.
Solana is displaying signs of strength as it trades with a key chart pattern, which indicates that the altcoin is preparing for a solid move. The price has been holding steady, forming lower highs and higher lows within a narrowing range. This pause in momentum could be setting the stage for another breakout.
Key Resistance Levels In Focus As Breakout ApproachesSolana has developed a bullish flag pattern on the daily chart, signaling a continuation of its uptrend. According to Dynamite Trader’s post on X, this pattern often precedes strong breakouts, suggesting that momentum could soon accelerate.
Currently, SOL’s price is holding above the midline of the flag, indicating underlying strength. However, it’s also testing the daily 100 moving average (MA100), which is acting as a dynamic resistance. SOL’s reaction to this level will be crucial in determining whether the bullish flag leads to a decisive breakout or a deeper consolidation.
Another analyst, Henry, highlighted that Solana is gearing up for a big move after completing a clean Cup and Handle breakout on the 4-hour chart, a bullish pattern that signals continuation. The breakout saw SOL flip the $149 resistance into support, a key technical shift.
If this level holds, Henry sees a rally toward the $168 to $174 zone, which aligns with previous resistance levels and bullish extension targets. He adds a warning that volatility is increasing, and high-leverage positions are at risk on both sides.
Solana is setting up a clean wedge on the weekly chart. Currently trading at $150, SOL has been consistently bouncing between support and resistance levels, which is known for building pressure before delivering sharp moves.
Talking about this, Top G emphasizes that if this plays out as expected, the next leg up could be significant, and $300 isn’t just speculation; it’s a realistic target based on the structure and behavior.
Holding Above The Breakout Zone Could Accelerate The Move UpwardSolana has broken above the downtrend line on the 4-hour chart. This move could mark a pivotal shift in short-term momentum, with potential bullish continuation if current levels hold.
If SOL maintains its position above this trend line, crypto analyst Bens BTC noted that the price could climb toward the next resistance area at $165. The price action is forming a bullish structure, and momentum indicators may soon align with the breakout, further supporting the continuation of the upside.
The asset had broken out with strong momentum and is now trading firmly within a long-term bullish channel, a structure that has supported uptrends. The price action looks clean, with higher highs and higher lows forming as SOL surges upward.
Furthermore, analyst Persis10t revealed that momentum is picking up, and as long as the channel remains intact, the path forward could be explosive. If the structure holds and attracts volume, Persis10t projects a target of $700+ in the next run, pointing to the upper boundary of the bullish channel as a magnet for price.
Why this matters
This altcoin story adds another data point to the current market tape and is useful when read alongside nearby source coverage.
Original source
Read on NewsBTCRelated market context

Hyperliquid (HYPE) Price Prediction: Symmetrical Triangle Breakout Puts $77 Target Back in Focus
The breakout comes after several sessions of price compression, with HYPE continuing to trade within a broader technical structure...

Ethereum (ETH) Price Prediction: ETH Holds Near $1,780 as Bulls Eye $1,860–$1,950, but $1,609 Remains Key Invalidation
Ethereum price is trading near $1,779 after a mixed 24-hour session, according to Brave New Coin data. ETH is down around 0.76% on...

Bitcoin (BTC) Price Prediction: BTC Holds $63K Support—Can Rising Active Addresses Offset Bearish Technical Signals?
Although the BTC price has remained near a key support zone, recent chart signals and Strategy’s sale of a portion of its Bitcoin...

XRP Price Prediction: Volume and ETF Inflow Send Ripple Token Higher
XRP price pushed above the $1.14 resistance area after buyers stepped in with heavy volume and bullish prediction. The token climb...

Solana adds 2M new addresses as bullish trend emerges
Solana's rapid user growth and transaction volume highlight its potential undervaluation, suggesting a future price correction is...

Bitcoin Price Prediction: Peter Brandt Might Dump BTC for Gold
Bitcoin is facing a test, and its price prediction is not helping. So far in 2026, BTC has fallen about 28%, while gold is down ju...