Solana Plunges 12%, But This Pattern Could Mean Decline Isn’t Over Yet
Solana has seen a price drawdown of around 12% during the past day, but if this pattern is to go by, there could be more decline on the way. Solana Has Seen A Crash Over The Last 24 Hours The cryptocurrency sector as a w...
Archive context
Older archive item. Useful for background and entity history, but not a fresh market-moving signal.

Solana has seen a price drawdown of around 12% during the past day, but if this pattern is to go by, there could be more decline on the way.
Solana Has Seen A Crash Over The Last 24 HoursThe cryptocurrency sector as a whole has plummeted during the past day, with Solana not being spared as its price has also gone through a notable decline. Below is a chart that shows how SOL’s recent performance has looked.
From the graph, it’s visible that Solana has suffered a steep plunge of almost 12% in this period, which is worse than many other top cryptocurrencies. Bitcoin (BTC), for instance, has seen a decline of around 5%.
Following this crash, Solana is now back at the $227 level. The asset has seemingly paused its fall for now, but it’s possible that it would resume soon.
SOL Has Breached Under Its Symmetrical TriangleIn a post on X earlier in the day, analyst Ali Martinez discussed about a Symmetrical Triangle that Solana had been trading inside. The “Symmetrical Triangle” here is a pattern from technical analysis (TA) that forms when the price of an asset consolidates between two trendlines of a roughly equal and opposite slope.
The upper line of the triangle connects together lower highs in the price, while the lower level joins higher lows. As the asset travels inside the pattern, its range gradually converges on the midpoint line.
Like other TA patterns, the upper level of this pattern is likely to provide resistance to the asset. Similarly, the lower line can help the cryptocurrency to reach a bottom.
A break out of either of the trendlines can imply a continuation of trend in that direction. That is, a break above the triangle is a bullish signal, while a fall under it can lead to a bearish outcome.
The Symmetrical Triangle is just one possible type of triangular-shaped formation that an asset can display. Two other popular ones are the Ascending and Descending Triangles, which occur when one of the trendlines is parallel to the time-axis (the upper one in the case of the former and the lower one for the latter).
Now, here is the chart shared by the analyst that shows the Symmetrical Triangle that the 1-hour price of Solana had been stuck inside over the past week:
From the graph, it’s visible that Solana was approaching the apex of the triangle when Martinez had made the post. As the consolidation becomes narrower, a breakout can become more probable to occur, which appears to be just what has happened with SOL in the hours since.
The height of this triangle was equal to a swing of around 20%. Usually, Symmetrical Triangle breakouts are of the same degree as the height of the pattern, so the analyst had noted that SOL could be primed for a 20% move.
While a breakout does seem to have occurred for Solana, it hasn’t yet elongated to this scale. It now remains to be seen whether the pattern would hold for the asset or not.
Why this matters
This altcoin story adds another data point to the current market tape and is useful when read alongside nearby source coverage.
Original source
Read on NewsBTCRelated market context

Bitwise’s Solana staking ETF crosses $1B in assets under management in just 10 months
BSOL's rapid growth highlights investor confidence in staking rewards, but its dominance poses risks to Solana's market stability...
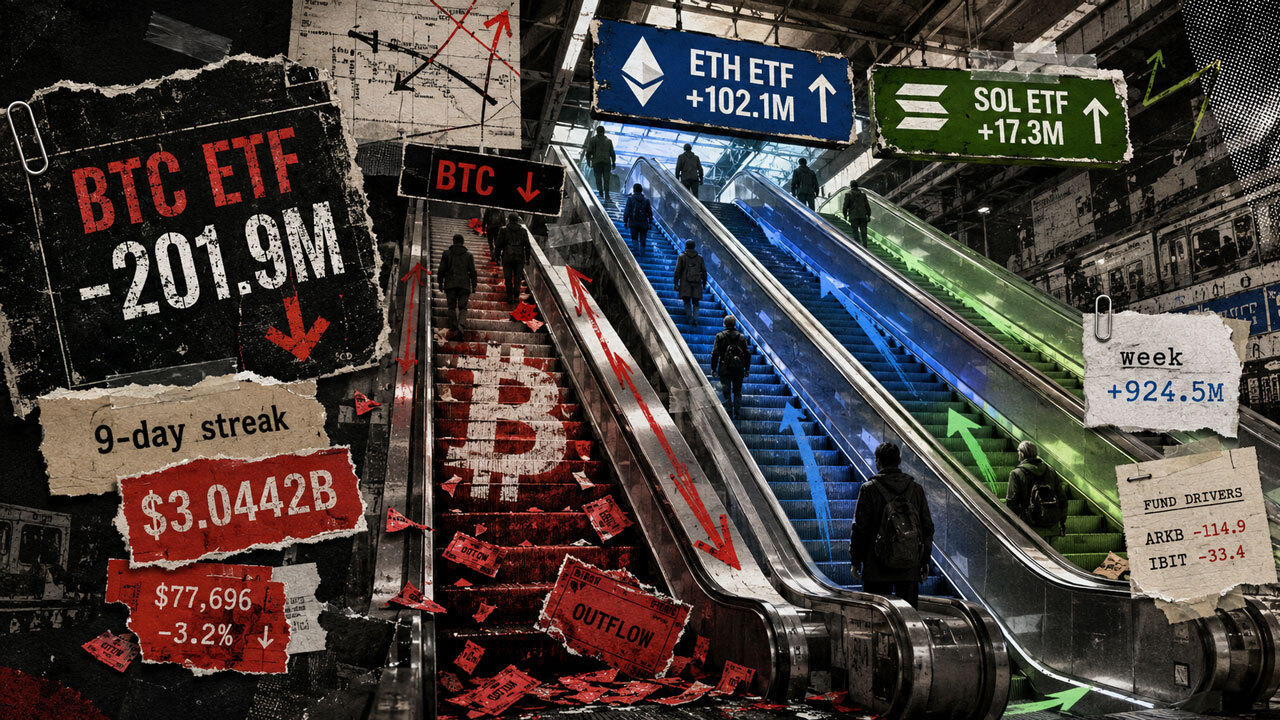
Bitcoin ETF inflows snap after $3 billion streak as ETH, XRP and Solana keep buying
US-listed Bitcoin exchange-traded funds (ETFs) lost $201.9 million Friday, ending a nine-day inflow streak as Ethereum, XRP and So...

Kraken and Galaxy flipped late as Solana approved a major supply cut
The proposal to double Solana’s annual disinflation rate has been marked Accepted after closing with 176.29 million SOL For, 66.19...

Dogecoin (DOGE) Price Prediction: DOGE Holds Near $0.084 as $0.09 Breakout Could Open $0.115
Dogecoin is back in the spotlight as price slips towards the $0.084 area, putting an important support zone under pressure. The la...

XRP Price Prediction: Momentum and $1.40 Floor to Hold
XRP price trades around the $1.40 to $1.45 range, down from the recent $1.70 peak as the token digests one of its sharpest weekly...

Deribit moved 90% of client assets to Coinbase, then killed its daily proof-of-reserves check
Deribit will remove its public Proof of Reserves page on Sept. 1, ending a daily check customers could use to verify balance inclu...