Solana Price At Crossroads: $129 Support, $144 Resistance Set Stage For Next Big Move
Solana’s price action over the past 24 hours has been marked by a decisive move above the $135 level, a development that could signal growing bullish momentum. This breakout follows several days of sideways movement, dur...
Archive context
Older archive item. Useful for background and entity history, but not a fresh market-moving signal.

Solana’s price action over the past 24 hours has been marked by a decisive move above the $135 level, a development that could signal growing bullish momentum. This breakout follows several days of sideways movement, during which the Solana price traded within a narrow range between $124 and $135.
Although the recent move above this consolidation zone hints at a potential upward continuation, on-chain data reveals that significant resistance awaits near $144, which may serve as the next major test for bulls.
Levels That Will Define Next Solana BreakoutAccording to a post on social media platform X by crypto analyst Ali Martinez, Solana’s current trading range between $129 and $144 is very important to how it goes from here. Particularly, Martinez noted that the most important support for the Solana price is at $129, while the key resistance to watch sits at $144.
This commentary aligns closely with the data shown in a chart shared by the analyst, sourced from Glassnode’s UTXO Realized Price Distribution (URPD): ATH-Partitioned model.
The volume bars shown in the URPD data below indicate that Solana’s price is boxed in between dense clusters of buying and selling activity. The tallest concentration is currently around the $129 to $144 region.
The chart highlights that roughly 5.75% of all the current realized volume for SOL occurred near the $129 price point, making this level a strong support zone. Interestingly, its importance was reinforced on April 17, when Solana’s price rebounded sharply after briefly dipping to this level.
Similarly, the $144 level also holds about 5% of the volume, acting as a resistance ceiling in the short term. This price zone previously rejected bullish attempts in the final week of March, confirming it as a short-term ceiling for upward momentum.
Together, these two levels form a tightly contested range, and a breakout beyond either boundary will likely dictate whether Solana enters a new bullish leg or retraces further.
Image From X: Ali_Charts
The UTXO Realized Price Distribution (URPD): ATH-Partitioned ModelThe UTXO Realized Price Distribution (URPD): ATH-Partitioned is an advanced on-chain metric that maps out where current coin holders acquired their tokens in relation to the all-time high (ATH). When a price level shows a high concentration of realized volume, it implies that a significant number of tokens were bought at that level.
These clusters tend to act as psychological support or resistance, since holders may be more inclined to defend breakeven zones (support) or exit at previous loss zones (resistance), depending on market sentiment.
In terms of market sentiment, current market sentiment is gradually turning bullish for Solana, and the recent break above $135 puts the $144 level in focus, at least in the short term. The price could reach there this new week, or a drawdown in sentiment could bring the $129 into focus as the level to hold.
At the time of writing, Solana was trading at $139, up by 3.6% in the past 24 hours.
Featured image from Mudrex, chart from TradingView
Why this matters
This altcoin story adds another data point to the current market tape and is useful when read alongside nearby source coverage.
Original source
Read on NewsBTCRelated market context
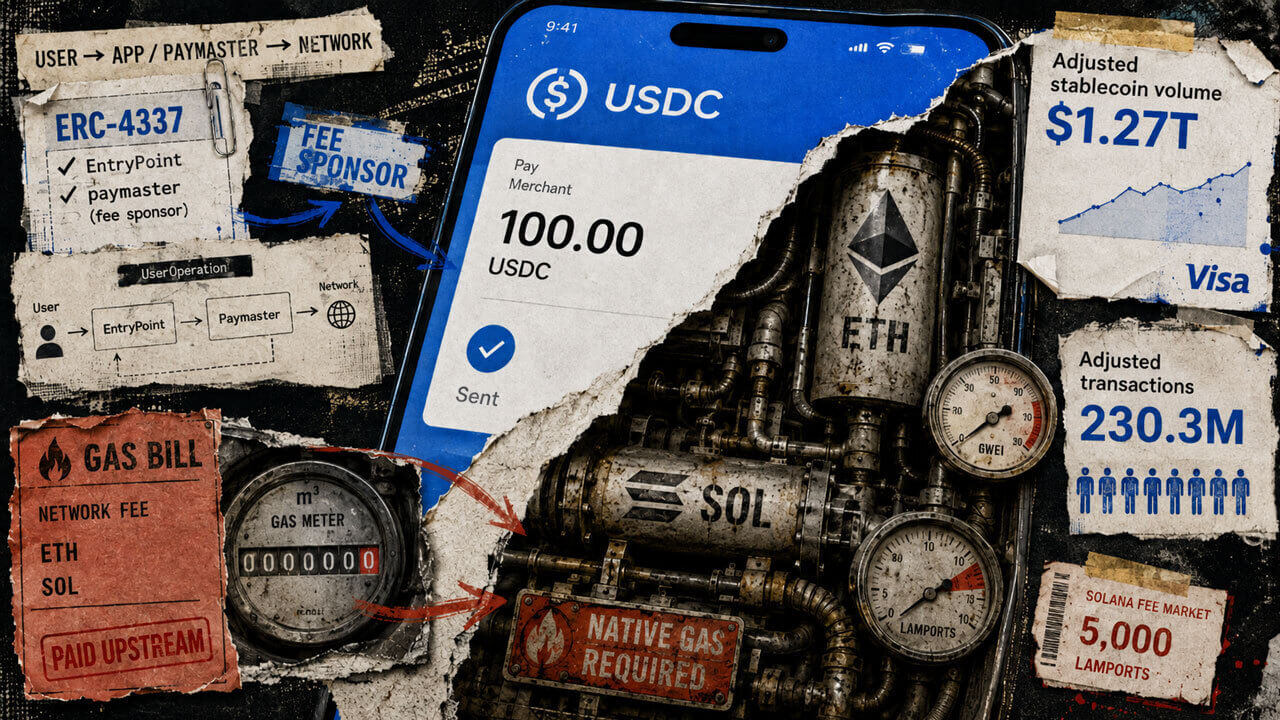
Ethereum and Solana are hosting trillions in dollar volume, yet their native tokens risk losing direct consumer demand
Matt Corallo followed up on an earlier post on Aug. 25, addressing what stablecoin users increasingly see: apps routing around ETH...

Morgan Stanley leads Solana ETF $9 million inflows as SOL jumps rises above $100
US Solana exchange-traded funds (ETFs) attracted about $9.1 million in net inflows on Aug. 26, led by Morgan Stanley’s MSOL. SoSoV...

Bitcoin (BTC) Price Prediction: Hidden Weekly RSI Divergence Warns of Pullback as BTC Tests $80K
Bitcoin price was trading around $80,500 on Bitstamp in the latest technical reading, up 3.11% on the session. While the price rem...

Bitcoin Price Prediction: Can BTC Get Back Over $80,000?
Today’s Bitcoin price prediction has BTC trading at $79,500, up around +1.1% over the past 24 hours, as the coin’s late-August gri...

Ripple Gets Mastercard Boost as XRP ETF Makes Major Changes
Mastercard deepens its ties to the Ripple ecosystem right as XRP ETF flows show signs of life again. The token is still nowhere ne...

Investors just moved $7 billion into Bitcoin and gold in five days to escape an accelerating dollar crisis
Gold and Bitcoin exchange-traded funds (ETFs) drew roughly $7 billion over five US trading sessions, a record combined haul that p...