Solana Price Could Eclipse $1,400 As Massive Bull Flag Emerges
The Solana price has surged over 33% in the past two weeks, and according to crypto analyst Ali Martinez (@ali_charts), this could be the precursor to a much larger rally. In the weekly chart (SOL/USD), the Solana price...
Archive context
Older archive item. Useful for background and entity history, but not a fresh market-moving signal.

The Solana price has surged over 33% in the past two weeks, and according to crypto analyst Ali Martinez (@ali_charts), this could be the precursor to a much larger rally. In the weekly chart (SOL/USD), the Solana price exhibits a major bullish pattern, suggesting a potential surge beyond the $1,400 mark.
Is $1,400 Next For Solana?Martinez highlighted a “bull flag” formation, a classic continuation pattern in technical analysis that could signify a significant upward movement in Solana’s value in the upcoming months. “The bull flag nobody is talking about!” Martinez commented.
The chart displays a bull flag pattern, identified through a sharp upward trend followed by a consolidating downward channel. This pattern began forming after a strong price increase from mid-September last year, where Solana ascended from around $17.50 to a peak of approximately $210. Following this rise, the price began to consolidate, forming a downward sloping channel that suggests a period of accumulation and potential buyer exhaustion after the initial surge.
The flagpole, an essential component of the bull flag pattern, was established by the initial steep increase in price, while the flag itself is represented by the subsequent consolidation phase. This phase is depicted by a series of higher lows and lower highs, converging into a narrowing point that suggests decreasing volatility and tightening price ranges—a typical precursor to a potential price breakout.
According to Martinez’ analysis, the price of Solana stands at $157.98 and thus just below the upper trendline of the channel. The consolidation has formed within a tight range, with the upper and lower boundaries clearly marked by trend lines converging towards a point on the chart projected to occur soon. The critical support level, as observed from the consolidation phase, is near the $130 mark, with the resistance level just slightly above the current price, around $160.
If the bull flag pattern holds true to its typical implications, a breakout could be expected upon reaching the apex of the converging trend lines. Historically, the projected target of a bull flag breakout is estimated by measuring the length of the flagpole—more than 1,000% in SOL’s case—and projecting it upwards from the point of breakout or from the support level (in a more conservative alternative).
This calculation would position the potential price target for Solana above $1,400, according to Martinez’ chart. In the more conservative scenario, Solana could also reach at least $1,300.
Key Resistance Levels For SOLOn the way towards the enormous price target, there are several resistances and intermediate price targets to overcome. In the short term, the 0.618 Fibonacci retracement level at $163 is the most important. Known as the “golden ratio,” this is currently the most watched resistance.
Afterwards the 0.786 Fib at $205 needs to be watched as a last major resistance before a price returns to the November 2021 all-time high at approximately $260.
The Fibonacci extension levels further offer potential targets if the Solana price surpasses its original high. The 161.8% extension at $415.23 marks a significant target for initial price discovery.
Subsequent levels like the 261.8% extension at $666 and the 361.8% level at $918 are crucial in a very strong trend where the price extends well beyond the initial range. Remarkably, even the 423.6% extension only predicts a rally in Solana’s price up to $1,074.
Why this matters
This altcoin story adds another data point to the current market tape and is useful when read alongside nearby source coverage.
Original source
Read on NewsBTCRelated market context
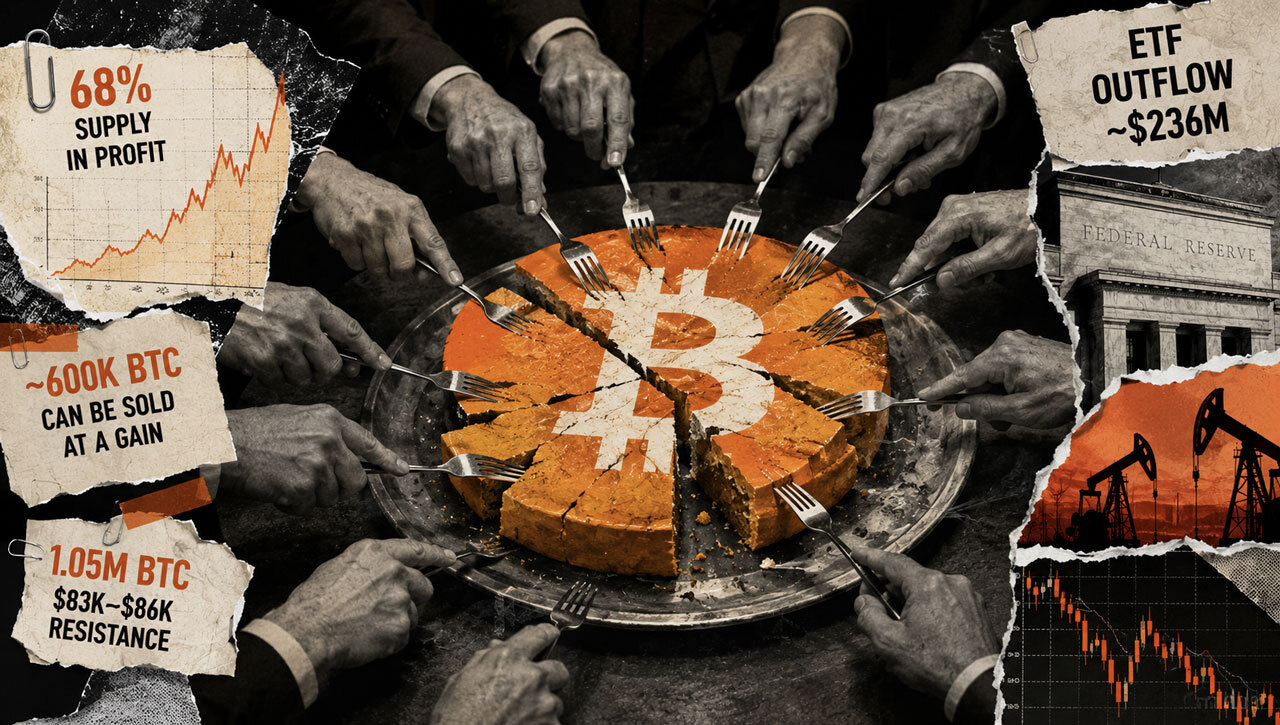
Bitcoin’s next $80,000 breakout has $47 billion more profitable supply to absorb
Bitcoin trades near $77,381, and Glassnode says 68% of circulating supply now sits in profit at this level, up from 65% when BTC t...

Ethereum Price Suppressed as Selling Pressure Mounts
Ethereum price is trading around $2,390, but the chart is starting to look tired. ETH has shed 3%-6% over the past week, and the b...

Google Gemini AI Predicts a +300% XRP Price Surge by 2027
We asked Google Gemini AI what it predicts the XRP price will be by the end of 2026, and the chatbot gave a very bullish answer su...

XRP Price Prediction: Ripple Edges Bitcoin In South Korea
XRP is down today, which puts our price prediction centered around the modest pullback that undersells what just happened in Seoul...

Sam Altman ChatGPT AI Predicts Wild Bitcoin Price in 2027
Bitcoin heads into the final months of 2026 with all the ingredients for another major move, although the market is far from unive...
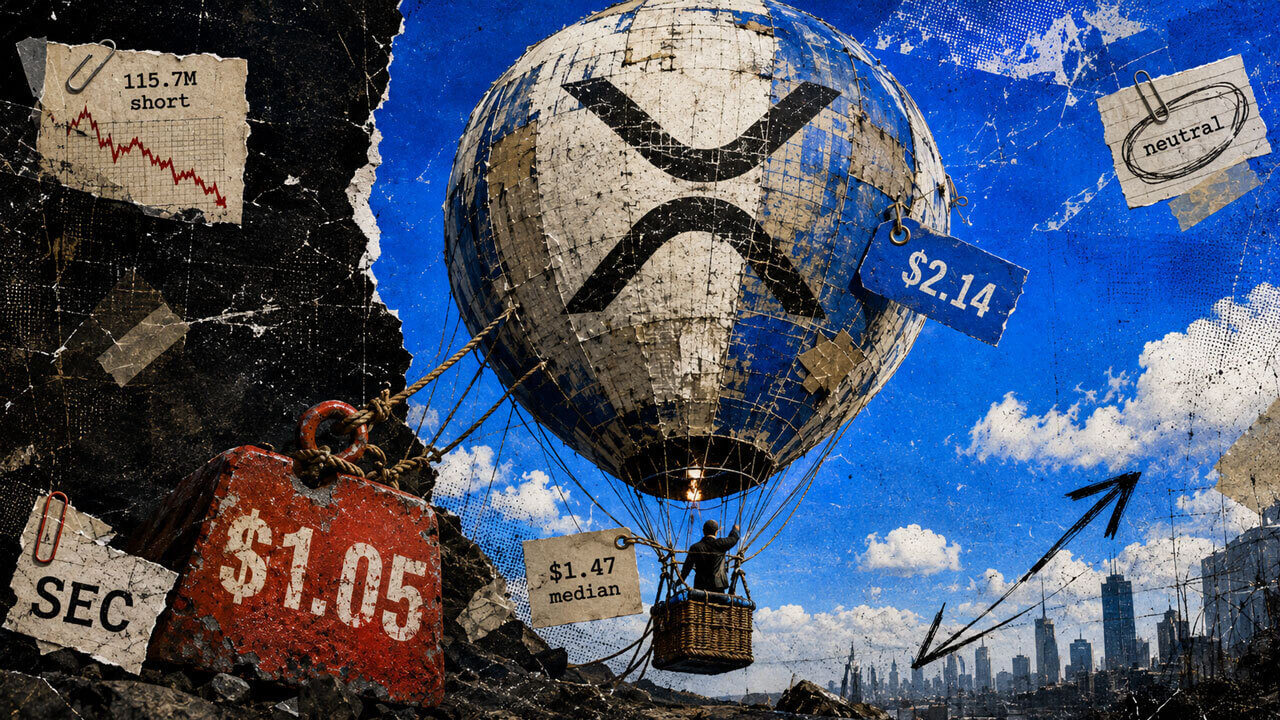
XRP’s $2.14 bull case just met a $474 million ETF tailwind
XRP could climb above $2.14 by late November as sustained exchange-traded fund (ETF) demand adds momentum to its recent rebound. C...