Solana Price Faces Uphill Task: Tough Road Ahead For SOL Bulls
Solana tested the $138 zone before it started a recovery wave. SOL price must clear the $150 and $155 resistance levels to start a steady increase. SOL price is eyeing an upside break above the $150 resistance against th...

Solana tested the $138 zone before it started a recovery wave. SOL price must clear the $150 and $155 resistance levels to start a steady increase.
- SOL price is eyeing an upside break above the $150 resistance against the US Dollar.
- The price is now trading above $145 and the 100-hourly simple moving average.
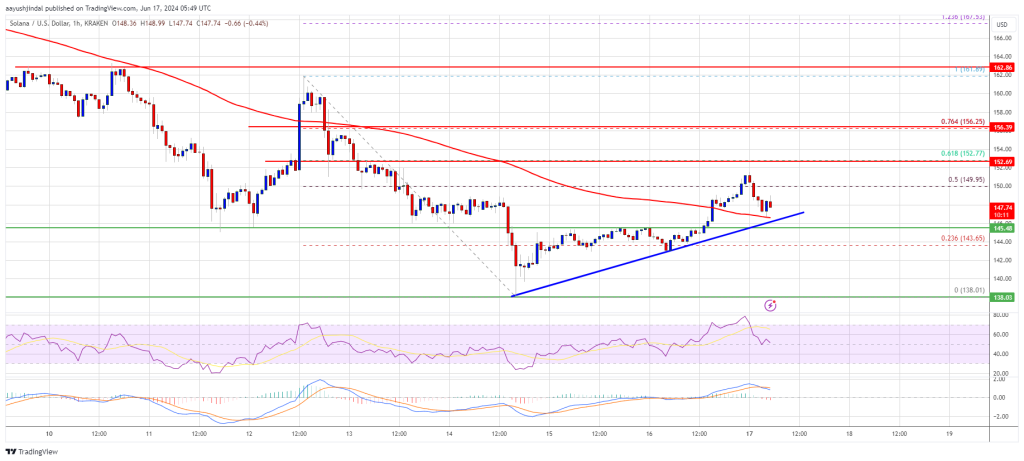
- There is a connecting bullish trend line forming with support at $146 on the hourly chart of the SOL/USD pair (data source from Kraken).
- The pair could clear the $152.50 resistance to start a short-term uptrend.
Solana price extended losses below the $150 level like Bitcoin and Ethereum. SOL even declined below the $142 support before the bulls appeared near the $138 level. A low was formed at $138.01 and the price recently started a decent recovery wave.
The price was able to clear the $142 and $145 resistance levels. There was a move above the 50% Fib retracement level of the downward move from the $161.89 swing high to the $138.01 low. Solana price is now trading above $145 and the 100-hourly simple moving average. There is also a connecting bullish trend line forming with support at $146 on the hourly chart of the SOL/USD pair.
Immediate resistance is near the $150 level. The next major resistance is near the $152.50 level or the 61.8% Fib retracement level of the downward move from the $161.89 swing high to the $138.01 low.
A successful close above the $152.50 resistance could set the pace for another major increase. The next key resistance is near $156.50. Any more gains might send the price toward the $160 level.
Another Decline in SOL?If SOL fails to rally above the $152.50 resistance, it could start another decline. Initial support on the downside is near the $145 level and the trend line.
The first major support is near the $142 level, below which the price could test $138. If there is a close below the $132 support, the price could decline toward the $125 support in the near term.
Technical Indicators
Hourly MACD – The MACD for SOL/USD is losing pace in the bullish zone.
Hourly Hours RSI (Relative Strength Index) – The RSI for SOL/USD is near the 50 level.
Major Support Levels – $145, and $142.
Major Resistance Levels – $152.50, $156.50, and $160.
Original source
Read on NewsBTCRelated market context

Uranium Holds Above $85 as Mining ETF Rebounds From June Sell-Off
The latest charts display that the market is divided into stable physical prices and uranium shares trying to regain momentum afte...

Bitcoin price faces new risk as big buyers lose conviction
Bitcoin’s largest buyers are no longer behaving like a reliable backstop for the largest cryptocurrency. The exchange-traded funds...

Google Gemini AI Predicts Jaw-Dropping XRP Price For Next 90 Days
Google Gemini AI just put XRP back under the spotlight, predicting it is tightly wound for a major breakout toward $1.60 to $1.80...

Bitcoin price challenges $64,000 weekend wall – needing a breakout or risk a deeper correction
Bitcoin reclaimed $64,000 on June 12 and touched an intraday high of $64,301 in the same session that spot ETF flows finally flipp...

Bitcoin rises above $64,000 after Pakistan prime minister says Iran peace deal is near
Bitcoin traded above $64,000 on Saturday, supported by its strongest ETF inflows in a month and growing optimism around geopolitic...

Standard Chartered Says Bitcoin Bottomed Near $59,000 As Crypto Winter Ends
TL;DR Standard Chartered’s Geoffrey Kendrick reportedly says Bitcoin’s $59,000 area marked the cycle bottom. The note cites SpaceX...