Solana Price Marches Toward $200, Why SOL Turned Attractive On Dips
Solana started a fresh increase above the $175 resistance. SOL price is up nearly 10% and might continue to rise if it clears the $188 resistance. SOL price jumped higher and tested the $188 resistance against the US Dol...

Solana started a fresh increase above the $175 resistance. SOL price is up nearly 10% and might continue to rise if it clears the $188 resistance.
- SOL price jumped higher and tested the $188 resistance against the US Dollar.
- The price is now trading above $180 and the 100-hourly simple moving average.
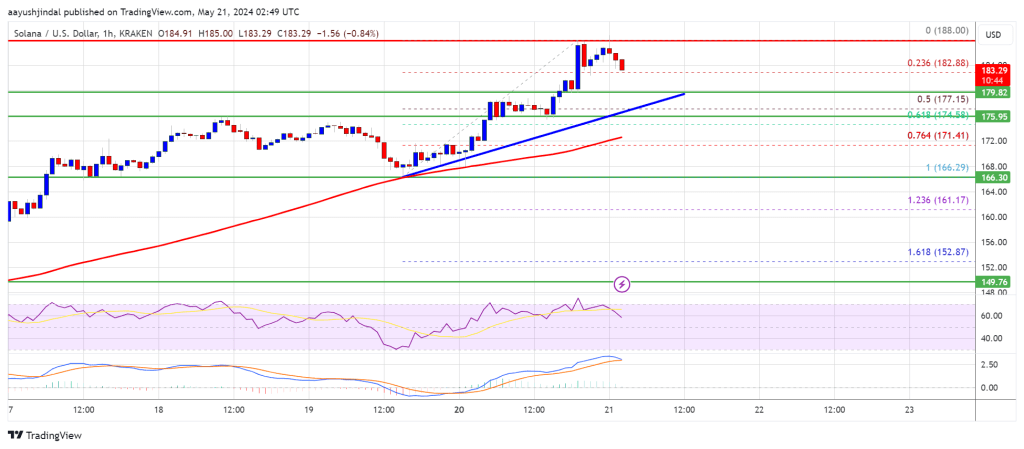
- There is a key bullish trend line forming with support at $175 on the hourly chart of the SOL/USD pair (data source from Kraken).
- The pair could clear the $188 resistance unless it fails to stay above $175.
Solana price formed a support base near the $166 level and started a fresh increase. SOL followed recent Bitcoin and Ethereum surge to move into a positive zone.
There was a move above the $175 and $180 resistance levels. The price even tested the $188 resistance. A high was formed at $188.00 and the price is now consolidating gains above the 23.6% Fib retracement level of the upward move from the $166 swing low to the $188 high.
Solana is now trading above $188 and the 100 simple moving average (4 hours). There is also a key bullish trend line forming with support at $175 on the hourly chart of the SOL/USD pair.
Immediate resistance is near the $185 level. The next major resistance is near the $188 level. A successful close above the $188 resistance could set the pace for another major increase. The next key resistance is near $195. Any more gains might send the price toward the $200 level.
Are Dips Supported in SOL?If SOL fails to rally above the $188 resistance, it could start a downside correction. Initial support on the downside is near the $182 level. The first major support is near the $178 level and the trend line.
The 50% Fib retracement level of the upward move from the $166 swing low to the $188 high is also at $178, below which the price could test $175. If there is a close below the $175 support, the price could decline toward the $166 support in the near term.
Technical Indicators
Hourly MACD – The MACD for SOL/USD is gaining pace in the bullish zone.
Hourly Hours RSI (Relative Strength Index) – The RSI for SOL/USD is above the 50 level.
Major Support Levels – $158, and $152.
Major Resistance Levels – $165, $172, and $180.
Original source
Read on NewsBTCRelated market context

BTC News Today: Bitcoin Climbs Toward $66K as Trump Reveals US-Iran Peace Deal
The renewed geopolitical optimism helped improve risk sentiment across financial markets, pushing Bitcoin back toward the $66,000...

Bitcoin Stabilizes Near Key Zone, But Glassnode Warns Capital Flows Remain Weak
Bitcoin’s rebound from the $60,000 area has given bulls something to work with, but Glassnode’s latest market read suggests the re...

Ethereum Research Proposal Targets Post-Quantum Wallet Security At Low Gas Cost
A new Ethereum Research proposal is putting post-quantum wallet security back in focus, outlining a practical way to verify quantu...

Bitcoin Price and Crypto Stocks Surge as Iran Ceasefire, Strategy’s $100M Buy Collide With Fed Week
Bitcoin Magazine Bitcoin Price and Crypto Stocks Surge as Iran Ceasefire, Strategy’s $100M Buy Collide With Fed Week Bitcoin price...
XRP Price Prediction: Ripple Jumps 10% as Crypto Total Market Cap Closing $2.4T
XRP price is moving again, and this time, prediction and volume back it up. The token has run 10% in the past 24 hours, pushing th...

XRP Price Prediction: US-Iran Peace Deal Fuels 13% XRP Surge, Analysts Target $1.94 Retest
The latest move saw XRP price today reclaim the $1.28 level for the first time in nearly two weeks. Market participants pointed to...