Solana Price Prediction: SOL Rallies 20% and Prints Bullish Breakout
Solana rallied over 20% and surpassed $15 against the US Dollar. SOL price is showing positive signs and might rise further above the $16.80 resistance. Sol price started a fresh increase above the $12 and $15 levels aga...

Solana rallied over 20% and surpassed $15 against the US Dollar. SOL price is showing positive signs and might rise further above the $16.80 resistance.
- Sol price started a fresh increase above the $12 and $15 levels against the US Dollar.
- The price is now trading above $15 and the 100 simple moving average (4-hours).
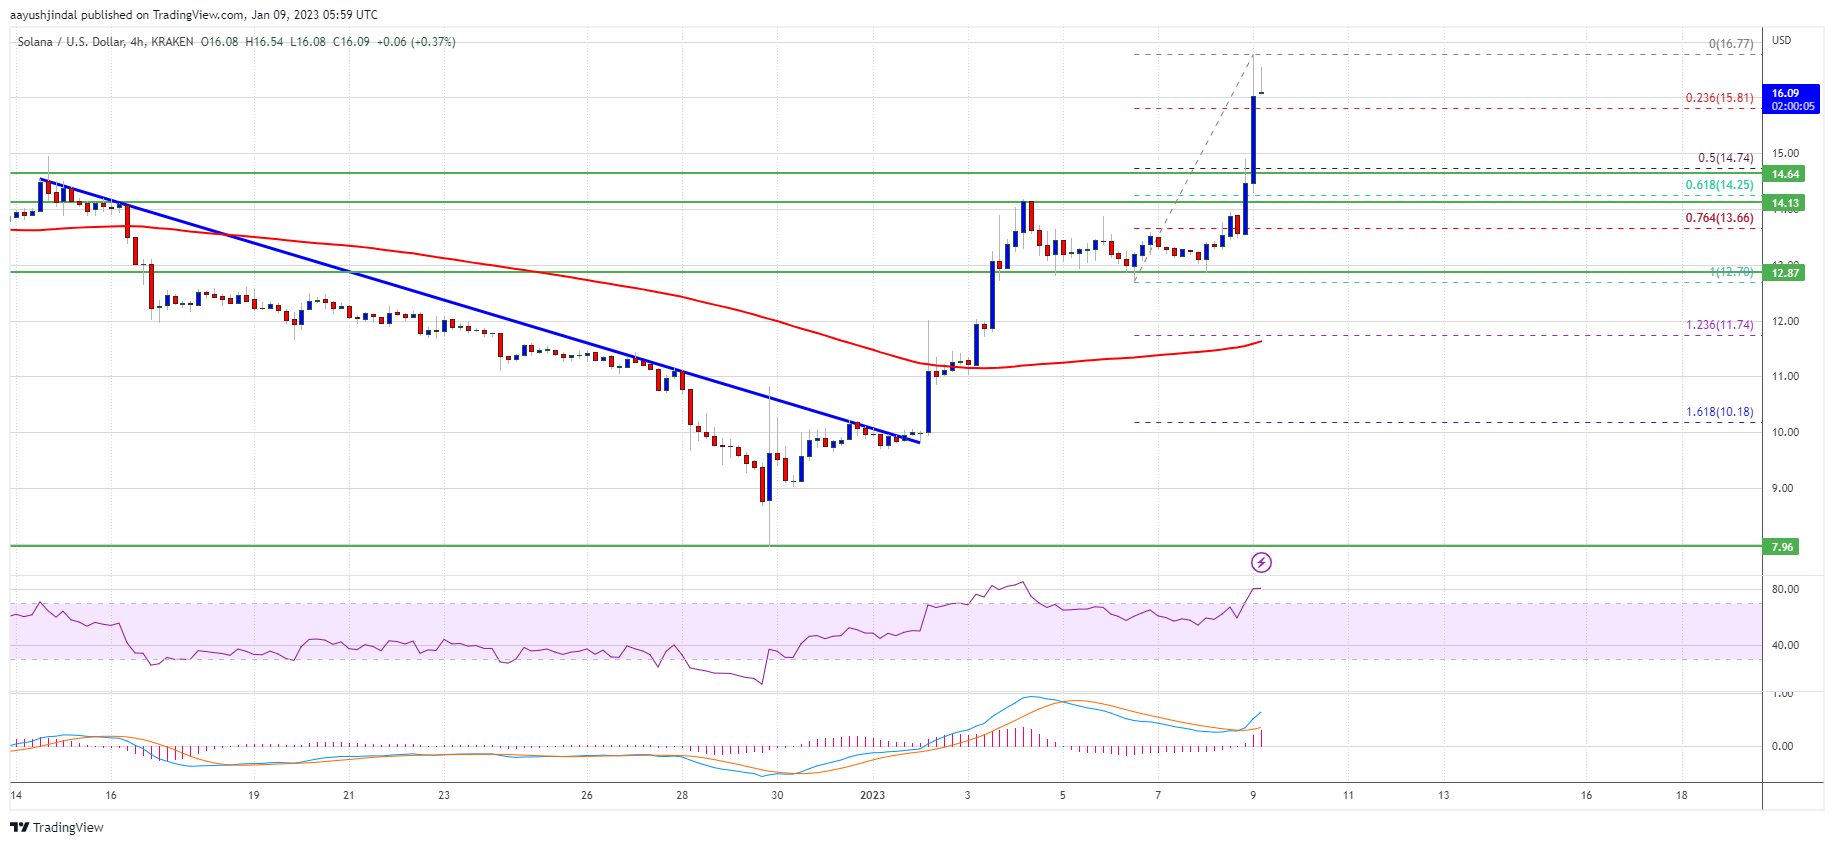
- There was a break above a major bearish trend line with resistance near $10.20 on the 4-hours chart of the SOL/USD pair (data source from Kraken).
- The pair could rise further if it stays above the $14.50 and $14.10 support levels.
This past month, solana price saw a strong decline from the $15 resistance zone. There was a drop below the $12.50 and $10 support levels to move into a bearish zone again.
The price traded as low as $7.96 and recently started a fresh increase. There was a strong move above the $10 and $12 resistance levels. Besides, there was a break above a major bearish trend line with resistance near $10.20 on the 4-hours chart of the SOL/USD pair.
Sol price is now trading above $15 and the 100 simple moving average (4-hours). The price is up over 20% and is showing positive signs, similar to bitcoin and ethereum.
Source: SOLUSD on TradingView.com
It is trading above the 23.6% Fib retracement level of the upward move from the $12.87 swing low to $16.77 high. On the upside, an immediate resistance is near the $16.80 level. The first major resistance is near the $17 level. The next major resistance is near the $18 zone, above which the price might rise towards the $20 barrier. Any more gains might send the price towards the $25 level.
Downsides Supported in SOL?If SOL fails to clear the $16.80 resistance, it could start a downside correction. An initial support on the downside is near the $15.80 level.
The first major support is near the $14.75 level. It is near the 50% Fib retracement level of the upward move from the $12.87 swing low to $16.77 high. The next major support is near the $14.10 level. If there is a downside break below the $14.10 support, the bears might even push the price below $13.50.
Technical Indicators
4-Hours MACD – The MACD for SOL/USD is gaining pace in the bullish zone.
4-Hours RSI (Relative Strength Index) – The RSI for SOL/USD is currently in the overbought zone.
Major Support Levels – $15.80, $14.75 and $14.10.
Major Resistance Levels – $16.80, $18 and $20.
Original source
Read on NewsBTCRelated market context

Standard Chartered Says Bitcoin Bottomed Near $59,000 As Crypto Winter Ends
TL;DR Standard Chartered’s Geoffrey Kendrick reportedly says Bitcoin’s $59,000 area marked the cycle bottom. The note cites SpaceX...

Tether USDT Briefly Overtakes Ethereum in Market Cap: A $187B Wake-Up Call
For a few hours, earlier this week, Tether USDT stablecoin held a higher market cap than Ethereum, the first time that has happene...

Google Gemini AI Predicts Jaw-Dropping XRP Price For Next 90 Days
Google Gemini AI just put XRP back under the spotlight, predicting it is tightly wound for a major breakout toward $1.60 to $1.80...

Bitcoin price challenges $64,000 weekend wall – needing a breakout or risk a deeper correction
Bitcoin reclaimed $64,000 on June 12 and touched an intraday high of $64,301 in the same session that spot ETF flows finally flipp...

Elon Musk SpaceX AI Predicts Incredible Bitcoin Price For Next 30 Days
Here is the thing about capitulation calls. They only sound smart in hindsight. Right now, with Bitcoin price scraping along the l...

Bitcoin rises above $64,000 after Pakistan prime minister says Iran peace deal is near
Bitcoin traded above $64,000 on Saturday, supported by its strongest ETF inflows in a month and growing optimism around geopolitic...