Solana Price Prediction: Why SOL Could Dive Another 50%
Solana is accelerating lower below $12 and $10 levels against the US Dollar. SOL price remains at a risk of a move towards the $7.50 and $7.00 levels. Sol price is struggling and trading well below the $12 level against...

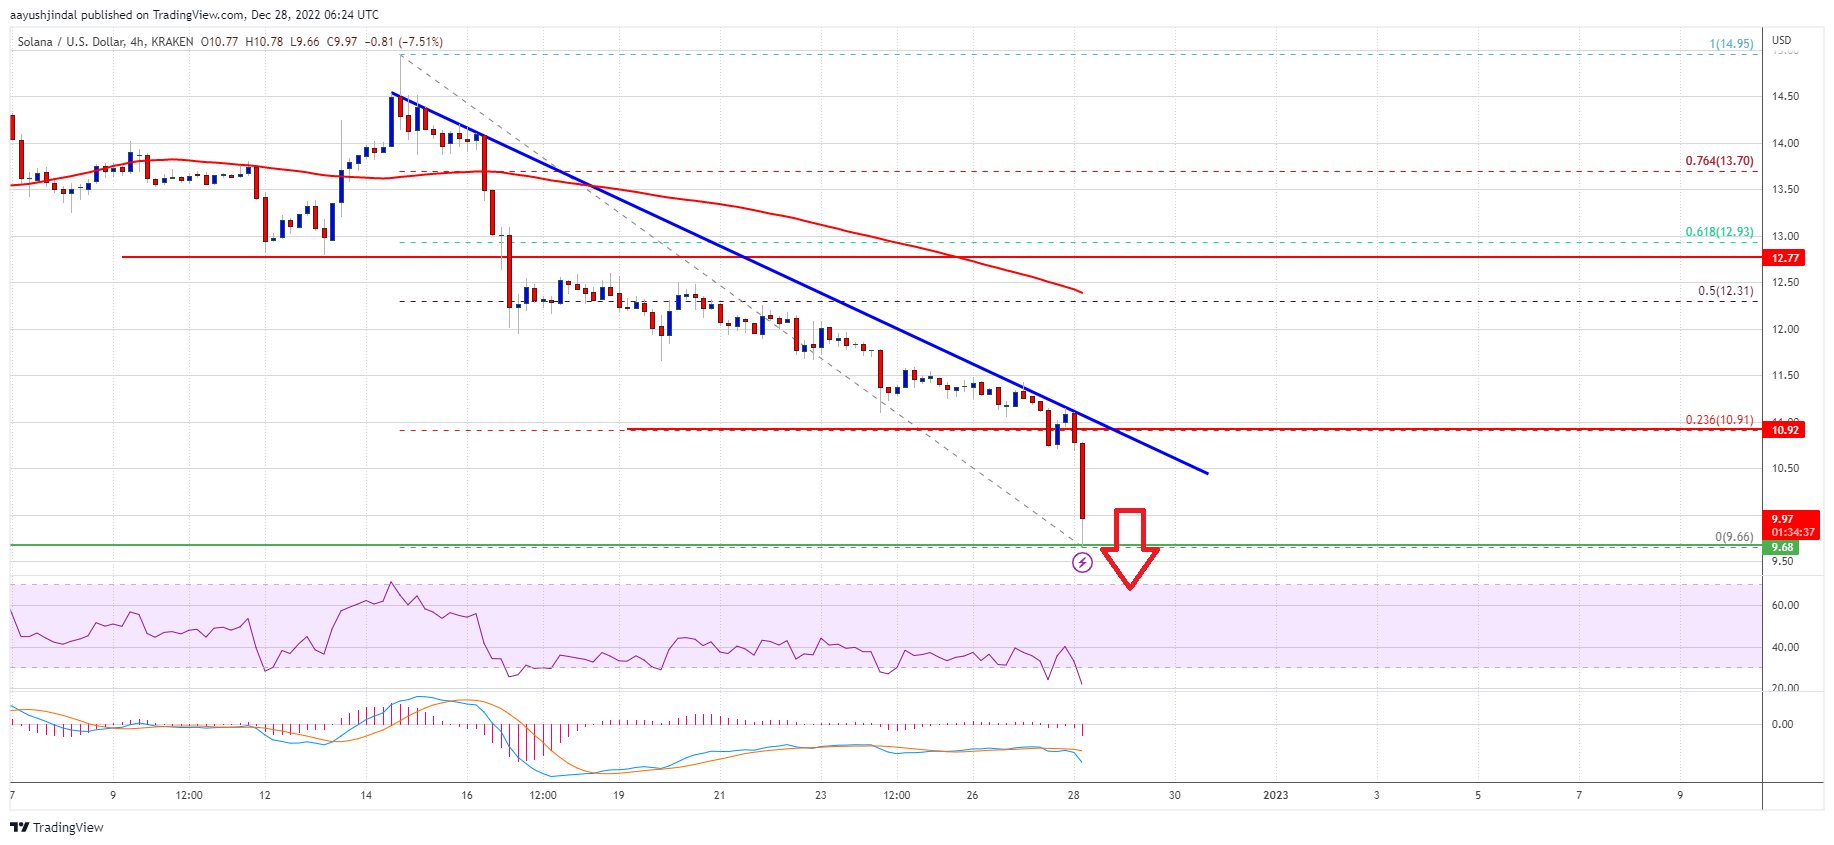
Solana is accelerating lower below $12 and $10 levels against the US Dollar. SOL price remains at a risk of a move towards the $7.50 and $7.00 levels.
- Sol price is struggling and trading well below the $12 level against the US Dollar.
- The price is now trading below $10 and the 100 simple moving average (4-hours).
- There is a major bearish trend line forming with resistance near $10.55 on the 4-hours chart of the SOL/USD pair (data source from Kraken).
- The pair could face a strong selling interest near $10.55 and $12 in the coming days.
This month, solana price saw a strong decline from the $15 resistance zone. There was a drop below the $13.50 and $12 support levels to move into a bearish zone again.
Sol price even dumped below the $10 level and the 100 simple moving average (4-hours). The price traded as low as $9.66 and is currently consolidating losses. There are clear strong bearish signs below the $10 level, unlike bitcoin and ethereum.
Besides, there is a major bearish trend line forming with resistance near $10.55 on the 4-hours chart of the SOL/USD pair. On the upside, an immediate resistance is near the $10.55 level and the trend line.
The first major resistance is near the $11 level. It is close to the 23.6% Fib retracement level of the main drop from the $14.95 swing high to $9.66 low. The next major resistance is near the $12 zone, above which the price might rise towards the 100 simple moving average (4-hours).
Source: SOLUSD on TradingView.com
The 50% Fib retracement level of the main drop from the $14.95 swing high to $9.66 low is also near $12.30 to act as a strong resistance. Any more gains might send the price towards the $15 level.
More Losses in SOL?If SOL fails to clear the $10.55 resistance, it could continue to move down. An initial support on the downside is near the $9.65 level.
The first major support is near the $9.20 level. The next major support is near the $8.20 level. If there is a downside break below the $8.20 support, the bears might even push the price below $7.50.
Technical Indicators
4-Hours MACD – The MACD for SOL/USD is gaining pace in the bearish zone.
4-Hours RSI (Relative Strength Index) – The RSI for SOL/USD is currently below the 50 level.
Major Support Levels – $9.65, $9.20 and $8.20.
Major Resistance Levels – $10.55, $11 and $12.
Original source
Read on NewsBTCRelated market context

Tether USDT Briefly Overtakes Ethereum in Market Cap: A $187B Wake-Up Call
For a few hours, earlier this week, Tether USDT stablecoin held a higher market cap than Ethereum, the first time that has happene...

US forces shoot down Iranian attack drones near Strait of Hormuz, Bitcoin drops below $73K
Geopolitical tensions near vital oil routes can destabilize financial markets, highlighting the interconnectedness of global secur...

Google Gemini AI Predicts Jaw-Dropping XRP Price For Next 90 Days
Google Gemini AI just put XRP back under the spotlight, predicting it is tightly wound for a major breakout toward $1.60 to $1.80...

Bitcoin price challenges $64,000 weekend wall – needing a breakout or risk a deeper correction
Bitcoin reclaimed $64,000 on June 12 and touched an intraday high of $64,301 in the same session that spot ETF flows finally flipp...

Standard Chartered Says Bitcoin Bottomed Near $59,000 As Crypto Winter Ends
TL;DR Standard Chartered’s Geoffrey Kendrick reportedly says Bitcoin’s $59,000 area marked the cycle bottom. The note cites SpaceX...

Are 24/7 CME Bitcoin futures a volatility cure — or a new leverage trap?
Wall Street got to trade Bitcoin around the clock just in time to watch the market fall apart. CME Group launched 24/7 trading for...