Solana Price Prediction: Why Upsides Could Be Limited in SOL
Solana tumbled below the $20 and $15 levels against the US Dollar. SOL price is now recovering, but upsides might be limited above $15 and $17. Sol price traded as low as $10.92 before it recovered a few points against t...

Solana tumbled below the $20 and $15 levels against the US Dollar. SOL price is now recovering, but upsides might be limited above $15 and $17.
- Sol price traded as low as $10.92 before it recovered a few points against the US Dollar.
- The price is now trading below $15 and the 100 simple moving average (4-hours).
- There was a break above a major bearish trend line with resistance near $12.45 on the 4-hours chart of the SOL/USD pair (data source from Kraken).
- The pair could face a strong selling interest near $15 and $17 in the coming days.
This month, solana price saw a strong downward move below the $30 level. There was a strong move below the $25 and $20 support levels.
Sol price even dumped below the $15 level. Finally, it found support near $11 and traded as low as $10.92. Recently, there was a minor upside correction similar to bitcoin and ethereum. The price was able to climb above the $11.50 and $11.85 levels.
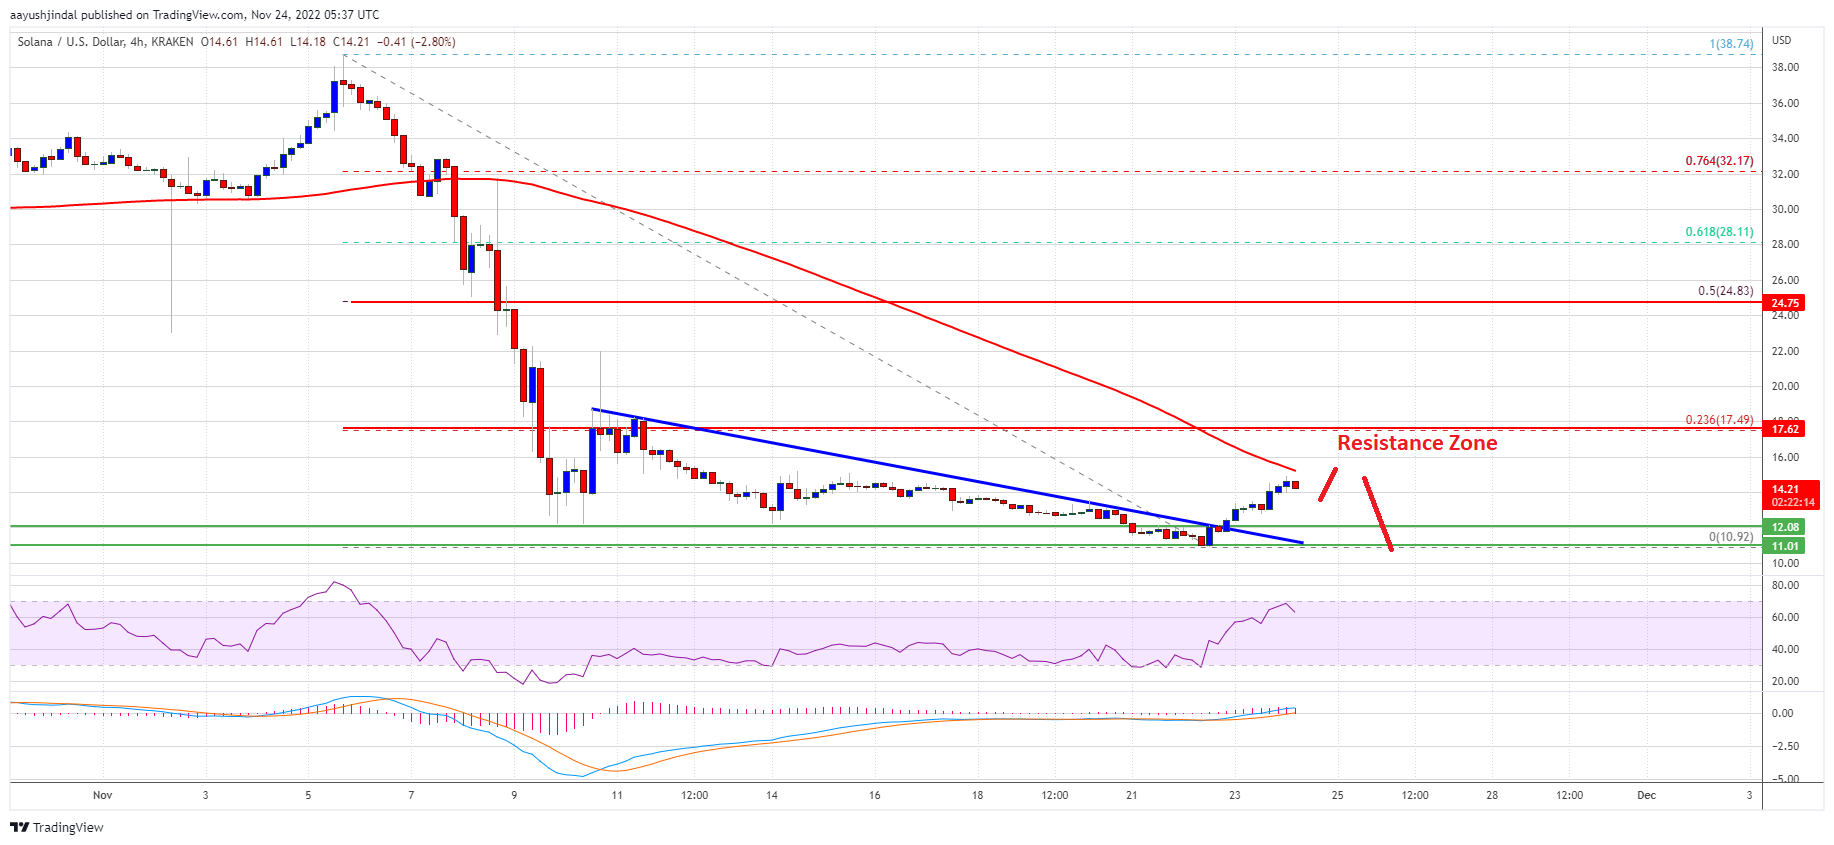
Besides, there was a break above a major bearish trend line with resistance near $12.45 on the 4-hours chart of the SOL/USD pair. However, the pair is still trading below $15 and the 100 simple moving average (4-hours).
On the upside, an immediate resistance is near the $15 level and the 100 simple moving average (4-hours). The next major resistance is near the $17 zone. It is close to the 23.6% Fib retracement level of the main drop from the $38.75 swing high to $10.92 low.
Source: SOLUSD on TradingView.com
A close above the $17 zone might send the price towards the $20 level in the near term. Any more gains might send the price towards the $25 level.
Fresh Decline in SOL?If SOL fails to clear the $15 resistance, it could start a fresh decline. An initial support on the downside is near the $13.00 level.
The first major support is near the $12 level. The next major support is near the $11 level or the recent low. If there is a downside break below the $11 support, the bears might even push the price below $10.
Technical Indicators
4-Hours MACD – The MACD for BNB/USD is losing pace in the bearish zone.
4-Hours RSI (Relative Strength Index) – The RSI for BNB/USD is currently above the 50 level.
Major Support Levels – $13, $12 and $11.
Major Resistance Levels – $15, $17 and $20.
Original source
Read on NewsBTCRelated market context

Uranium Holds Above $85 as Mining ETF Rebounds From June Sell-Off
The latest charts display that the market is divided into stable physical prices and uranium shares trying to regain momentum afte...

Manuel Neuer becomes Germany’s oldest player at major tournament as NEUER meme token surfaces on Solana
Neuer's milestone highlights the enduring nature of sports careers, while the NEUER token underscores the speculative risks in cry...

Tether USDT Briefly Overtakes Ethereum in Market Cap: A $187B Wake-Up Call
For a few hours, earlier this week, Tether USDT stablecoin held a higher market cap than Ethereum, the first time that has happene...

Bitcoin price challenges $64,000 weekend wall – needing a breakout or risk a deeper correction
Bitcoin reclaimed $64,000 on June 12 and touched an intraday high of $64,301 in the same session that spot ETF flows finally flipp...

Bitcoin rises above $64,000 after Pakistan prime minister says Iran peace deal is near
Bitcoin traded above $64,000 on Saturday, supported by its strongest ETF inflows in a month and growing optimism around geopolitic...

Standard Chartered Says Bitcoin Bottomed Near $59,000 As Crypto Winter Ends
TL;DR Standard Chartered’s Geoffrey Kendrick reportedly says Bitcoin’s $59,000 area marked the cycle bottom. The note cites SpaceX...