Solana Price Rally Targets $360—But This Support Must Hold
Solana’s native token is extending an impressive May run that has already carried the market-cap leader among non-EVM smart-contract platforms from $146 at the end of April to as high as $18” in Wednesday trading, the hi...
Archive context
Older archive item. Useful for background and entity history, but not a fresh market-moving signal.

Solana’s native token is extending an impressive May run that has already carried the market-cap leader among non-EVM smart-contract platforms from $146 at the end of April to as high as $18” in Wednesday trading, the highest daily close recorded since mid-February.
Against that backdrop, independent analyst More Crypto Online (MCO) released a fresh video update outlining why the move is technically “very full but not necessarily overextended or overstretched.” In the clip, MCO reiterates that the advance from the 30 April swing low traces out “a five-wave pattern” and stresses that, because “there was no confirmed top, one more high was still likely especially as long as this micro-support area held.” The micro zone he referenced earlier in the week lay between $159.67 and $168.23, a range Solana tested briefly before powering higher.
Solana Could Surge To $360Zooming in, the channel’s Elliott-wave count now shows five clean waves even on what MCO calls “the nano level,” a configuration that, in classical wave theory, typically finishes either an impulsive first wave or the terminating leg of a diagonal.
“If it’s a five-wave move, it can be a so-called A-wave,” the analyst explains, which would “result in a B-wave, ideally a higher low, and then a C-wave up.” The alternative—and MCO’s preferred scenario—treats the structure as wave 1 of a much larger impulse that could ultimately “easily get to $360 or higher.”
For traders trying to calibrate risk in the near term, MCO isolates two numbers that matter most. On the upside he names $191.25 as “the next upside level to watch,” describing it as the 61.8 percent extension of waves 1 and 3—a textbook Fibonacci target for a fifth wave.
On the downside he warns that “it takes a break below $172, which is the last swing low, to indicate that a price top has formed in wave 1.” In a follow-up post on X he put it even more succinctly: “5th wave to the upside is confirmed. $191.25 is the next upside level to watch … it takes a break below $172 … to indicate that a price top has formed.”
A clean, high-volume break of $191.25 would confirm that the immediate corrective risk has been deferred; a decisive daily close beneath $172 would instead signal that the first leg of the new advance has exhausted itself and that a retracement toward the upper-$160s or even the mid-$150s is underway.
As ever, traders should remember that Elliott-wave projections are probabilistic rather than predictive. With volatility historically elevated in Solana, position sizing—alongside a clear plan for the two technical levels singled out in today’s analysis—remains the first line of defence.
At press time, SOL traded at $180.
Why this matters
This altcoin story adds another data point to the current market tape and is useful when read alongside nearby source coverage.
Original source
Read on NewsBTCRelated market context
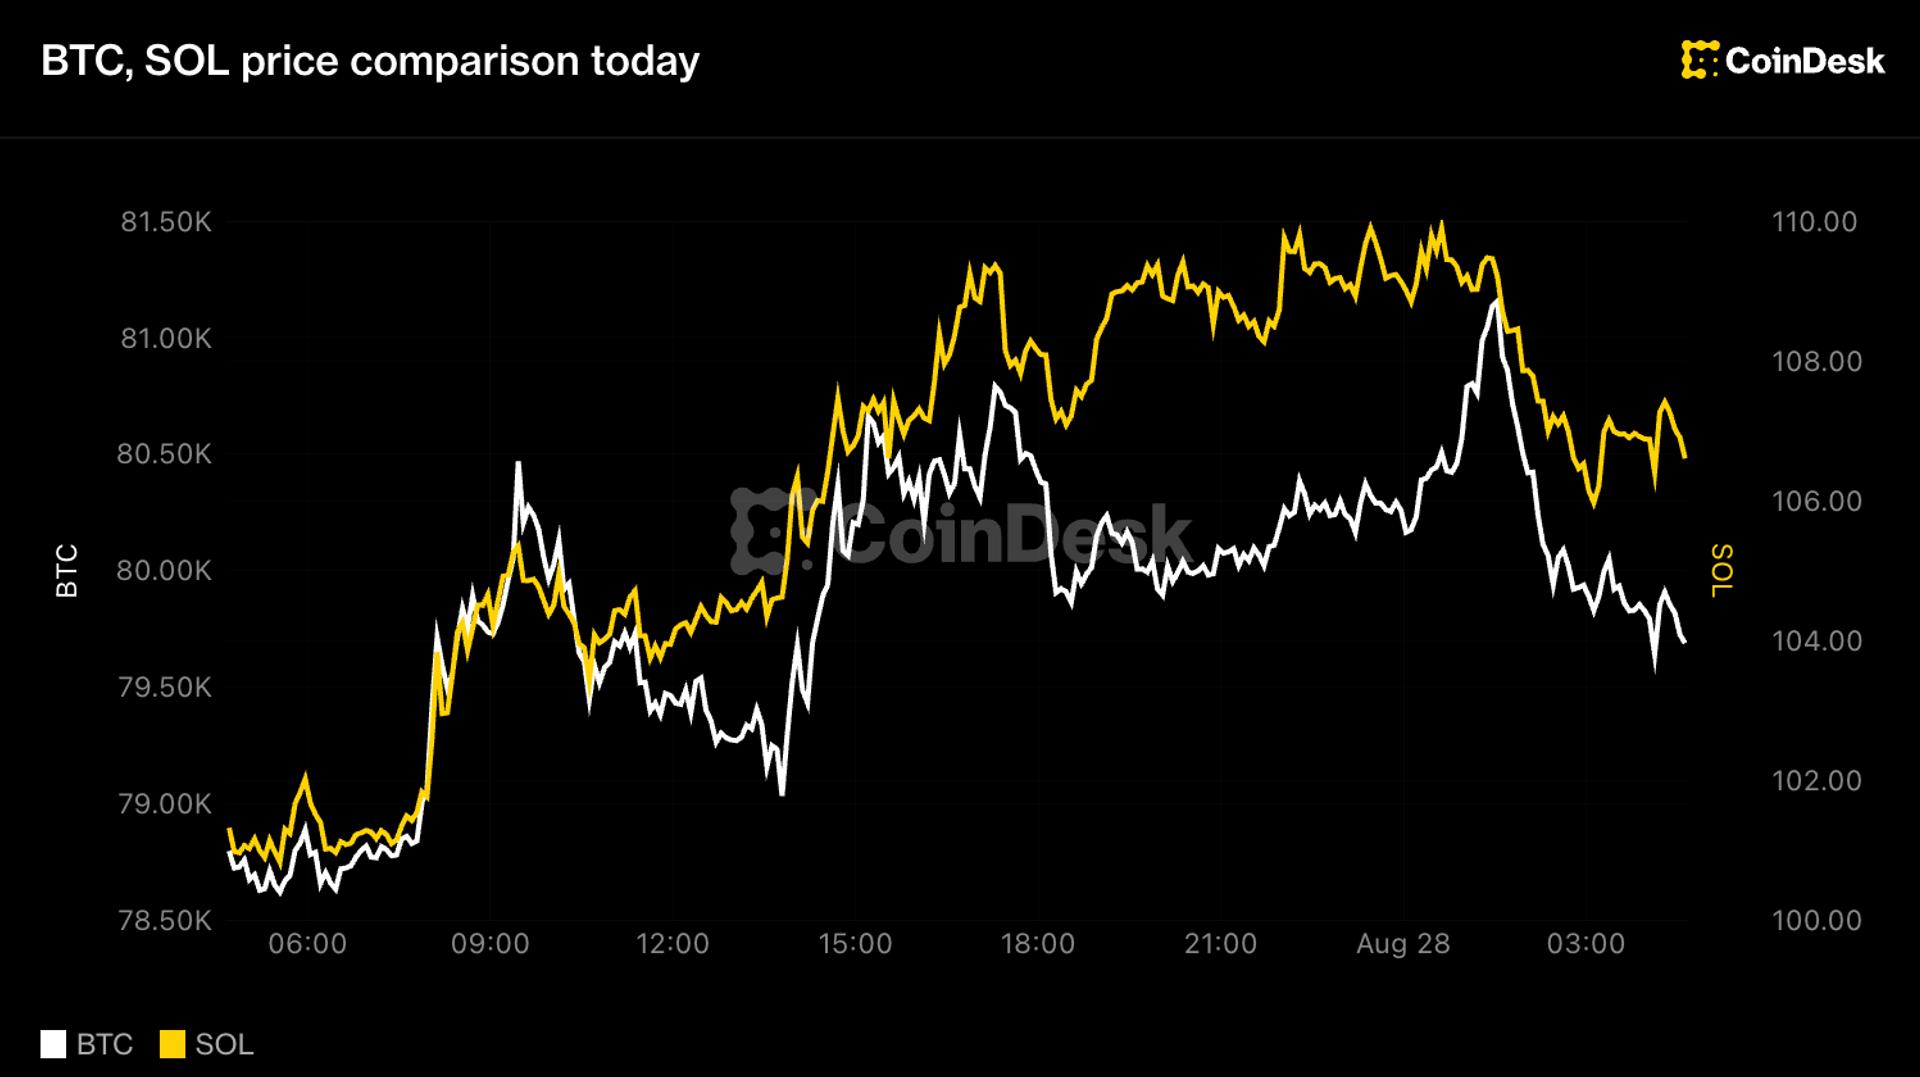
Bitcoin under $80,000, solana leads majors higher before Warsh's Jackson Hole debut
Every major but HYPE gained over 24 hours, capping a week that added 9% to bitcoin and 20% to solana.

Morgan Stanley leads Solana ETF $9 million inflows as SOL jumps rises above $100
US Solana exchange-traded funds (ETFs) attracted about $9.1 million in net inflows on Aug. 26, led by Morgan Stanley’s MSOL. SoSoV...

Pump.fun surpasses $50M in monthly revenue, outpacing Solana itself
Pump.fun's success highlights the potential for application-layer innovations to redefine value distribution in blockchain ecosyst...

Solana token hits 8-month high, surpassing $109 against Bitcoin
Solana's surge reflects shifting trader sentiment and potential volatility, highlighting increased interest in alternative blockch...

Bitcoin (BTC) Price Prediction: Hidden Weekly RSI Divergence Warns of Pullback as BTC Tests $80K
Bitcoin price was trading around $80,500 on Bitstamp in the latest technical reading, up 3.11% on the session. While the price rem...

Bitcoin Price Prediction: Can BTC Reclaim $80K This Week?
Bitcoin price prediction has the leading digital asset trading at $79,400, down -0.4% on the day, as the market digests a violent...