Solana Price (SOL) Targets New Monthly High: Bulls in Control
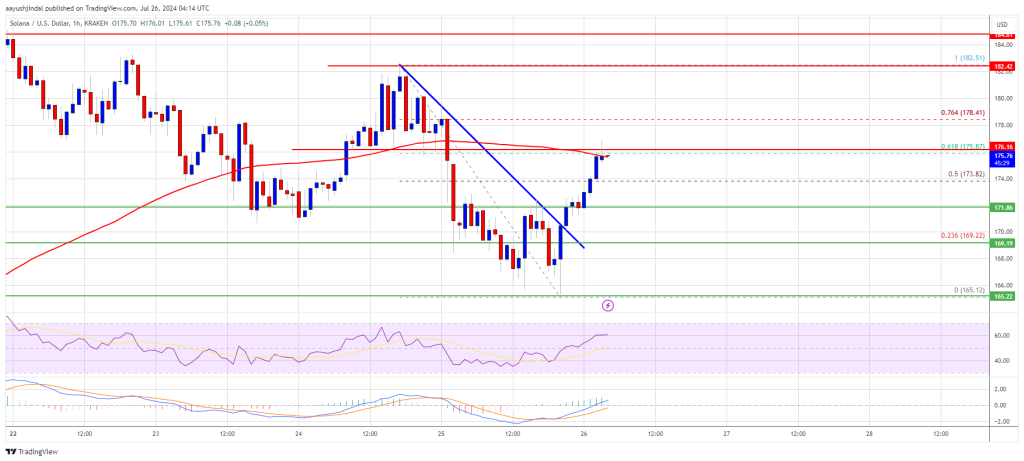
Solana started a fresh increase from the $165 zone. SOL price is showing signs of strength and might climb further above the $182.50 resistance. SOL price started a decent upward move from the $165 support against the US...

Solana started a fresh increase from the $165 zone. SOL price is showing signs of strength and might climb further above the $182.50 resistance.
- SOL price started a decent upward move from the $165 support against the US Dollar.
- The price is now trading near $175 and the 100-hourly simple moving average.
- There was a break above a connecting bearish trend line with resistance at $170 on the hourly chart of the SOL/USD pair (data source from Kraken).
- The pair could aim for more upsides if it clears the $182.50 resistance level.
Solana price started a downside correction from $152.50 like Bitcoin and Ethereum. It traded below the $175 and $172 support levels. There was a drop below the $170 level.
Finally, it tested the $165 support. A low is formed at $165.12 and the price is again rising. There was a break above the $170 and $172 resistance levels. The price surpassed the 50% Fib retracement level of the downward move from the $182.51 swing high to the $165.12 low.
Besides, there was a break above a connecting bearish trend line with resistance at $170 on the hourly chart of the SOL/USD pair. Solana is now trading near the $175 level. It seems to be struggling near the 61.8% Fib retracement level of the downward move from the $182.51 swing high to the $165.12 low.
On the upside, the price is facing resistance near the $175 level. The next major resistance is near the $182.50 level. A successful close above the $182.50 resistance could set the pace for another steady increase. The next key resistance is near $192. Any more gains might send the price toward the $200 level.
Are Dips Limited in SOL?If SOL fails to rise above the $182.50 resistance, it could start another decline. Initial support on the downside is near the $172 level. The first major support is near the $170 level.
A break below the $170 level might send the price toward $165. If there is a close below the $165 support, the price could decline toward the $155 support in the near term.
Technical Indicators
Hourly MACD – The MACD for SOL/USD is gaining pace in the bullish zone.
Hourly Hours RSI (Relative Strength Index) – The RSI for SOL/USD is above the 50 level.
Major Support Levels – $172 and $170.
Major Resistance Levels – $175 and $182.50.
Original source
Read on NewsBTCRelated market context

Uranium Holds Above $85 as Mining ETF Rebounds From June Sell-Off
The latest charts display that the market is divided into stable physical prices and uranium shares trying to regain momentum afte...

Bitcoin price challenges $64,000 weekend wall – needing a breakout or risk a deeper correction
Bitcoin reclaimed $64,000 on June 12 and touched an intraday high of $64,301 in the same session that spot ETF flows finally flipp...

Bitcoin price faces new risk as big buyers lose conviction
Bitcoin’s largest buyers are no longer behaving like a reliable backstop for the largest cryptocurrency. The exchange-traded funds...

Google Gemini AI Predicts Jaw-Dropping XRP Price For Next 90 Days
Google Gemini AI just put XRP back under the spotlight, predicting it is tightly wound for a major breakout toward $1.60 to $1.80...

Bitcoin Mining Cost Model Points To $47,000 Floor, But Analysts Urge Caution
TL;DR Crypto Rover says Bitcoin has never bottomed below electrical production cost, currently estimated at $47,000. Mining-cost m...

Bitcoin rises above $64,000 after Pakistan prime minister says Iran peace deal is near
Bitcoin traded above $64,000 on Saturday, supported by its strongest ETF inflows in a month and growing optimism around geopolitic...