Solana Price (SOL) Turns Red: Key Supports That May Spark a Bullish Upside?
Solana started a fresh decline below $150 and $142. SOL price tested $128 and is currently struggling to start a recovery wave. SOL price started a fresh downward move below $150 against the US Dollar. The price is now t...

Solana started a fresh decline below $150 and $142. SOL price tested $128 and is currently struggling to start a recovery wave.
- SOL price started a fresh downward move below $150 against the US Dollar.
- The price is now trading below $140 and the 100-hourly simple moving average.
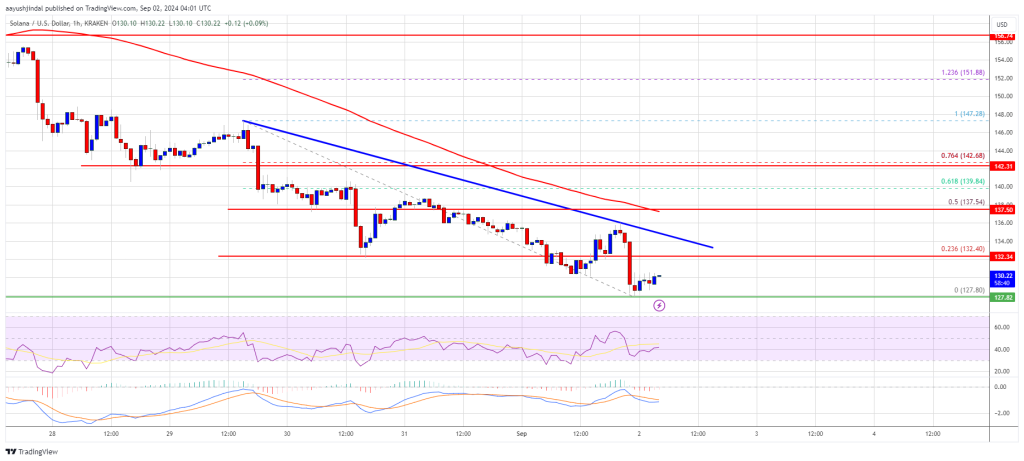
- There is a connecting bearish trend line forming with resistance at $134 on the hourly chart of the SOL/USD pair (data source from Kraken).
- The pair could start a recovery wave if it clears the $138 resistance zone.
Solana price started a fresh decline below the $150 support like Bitcoin and Ethereum. SOL gained pace and traded below the $142 level. It even tested the $128 support level.
A low was formed at $127.80 and the price is now consolidating losses. The price is showing some signs of a recovery wave, but it is still below the 23.6% Fib retracement level of the downward move from the $147.28 swing high to the $127.80 low.
Solana is now trading well below $140 and the 100-hourly simple moving average. On the upside, the price is facing resistance near the $132.50 level. There is also a connecting bearish trend line forming with resistance at $134 on the hourly chart of the SOL/USD pair.
The next major resistance is near the $138 level or the 50% Fib retracement level of the downward move from the $147.28 swing high to the $127.80 low. A successful close above the $134 and $138 resistance levels could set the pace for another steady increase. The next key resistance is near $142. Any more gains might send the price toward the $150 level.
More Downsides in SOL?If SOL fails to rise above the $138 resistance, it could start another decline. Initial support on the downside is near the $128 level. The first major support is near the $122 level.
A break below the $122 level might send the price toward $115. If there is a close below the $115 support, the price could decline toward the $100 support in the near term.
Technical Indicators
Hourly MACD – The MACD for SOL/USD is gaining pace in the bearish zone.
Hourly Hours RSI (Relative Strength Index) – The RSI for SOL/USD is below the 50 level.
Major Support Levels – $128 and $122.
Major Resistance Levels – $134 and $138.
Original source
Read on NewsBTCRelated market context

Uranium Holds Above $85 as Mining ETF Rebounds From June Sell-Off
The latest charts display that the market is divided into stable physical prices and uranium shares trying to regain momentum afte...

Bitcoin price challenges $64,000 weekend wall – needing a breakout or risk a deeper correction
Bitcoin reclaimed $64,000 on June 12 and touched an intraday high of $64,301 in the same session that spot ETF flows finally flipp...

US forces shoot down Iranian attack drones near Strait of Hormuz, Bitcoin drops below $73K
Geopolitical tensions near vital oil routes can destabilize financial markets, highlighting the interconnectedness of global secur...

Google Gemini AI Predicts Jaw-Dropping XRP Price For Next 90 Days
Google Gemini AI just put XRP back under the spotlight, predicting it is tightly wound for a major breakout toward $1.60 to $1.80...

Elon Musk SpaceX AI Predicts Incredible Bitcoin Price For Next 30 Days
Here is the thing about capitulation calls. They only sound smart in hindsight. Right now, with Bitcoin price scraping along the l...

Standard Chartered Says Bitcoin Bottomed Near $59,000 As Crypto Winter Ends
TL;DR Standard Chartered’s Geoffrey Kendrick reportedly says Bitcoin’s $59,000 area marked the cycle bottom. The note cites SpaceX...