Solana (SOL) at Crossroads — Bounce Likely If $142 Remains Intact
Solana started a fresh decline and retested the $145 support zone. SOL price is now recovering and might aim for a fresh increase above the $150 zone. SOL price started a fresh decline after it failed to clear $160 again...
Archive context
Older archive item. Useful for background and entity history, but not a fresh market-moving signal.

Solana started a fresh decline and retested the $145 support zone. SOL price is now recovering and might aim for a fresh increase above the $150 zone.
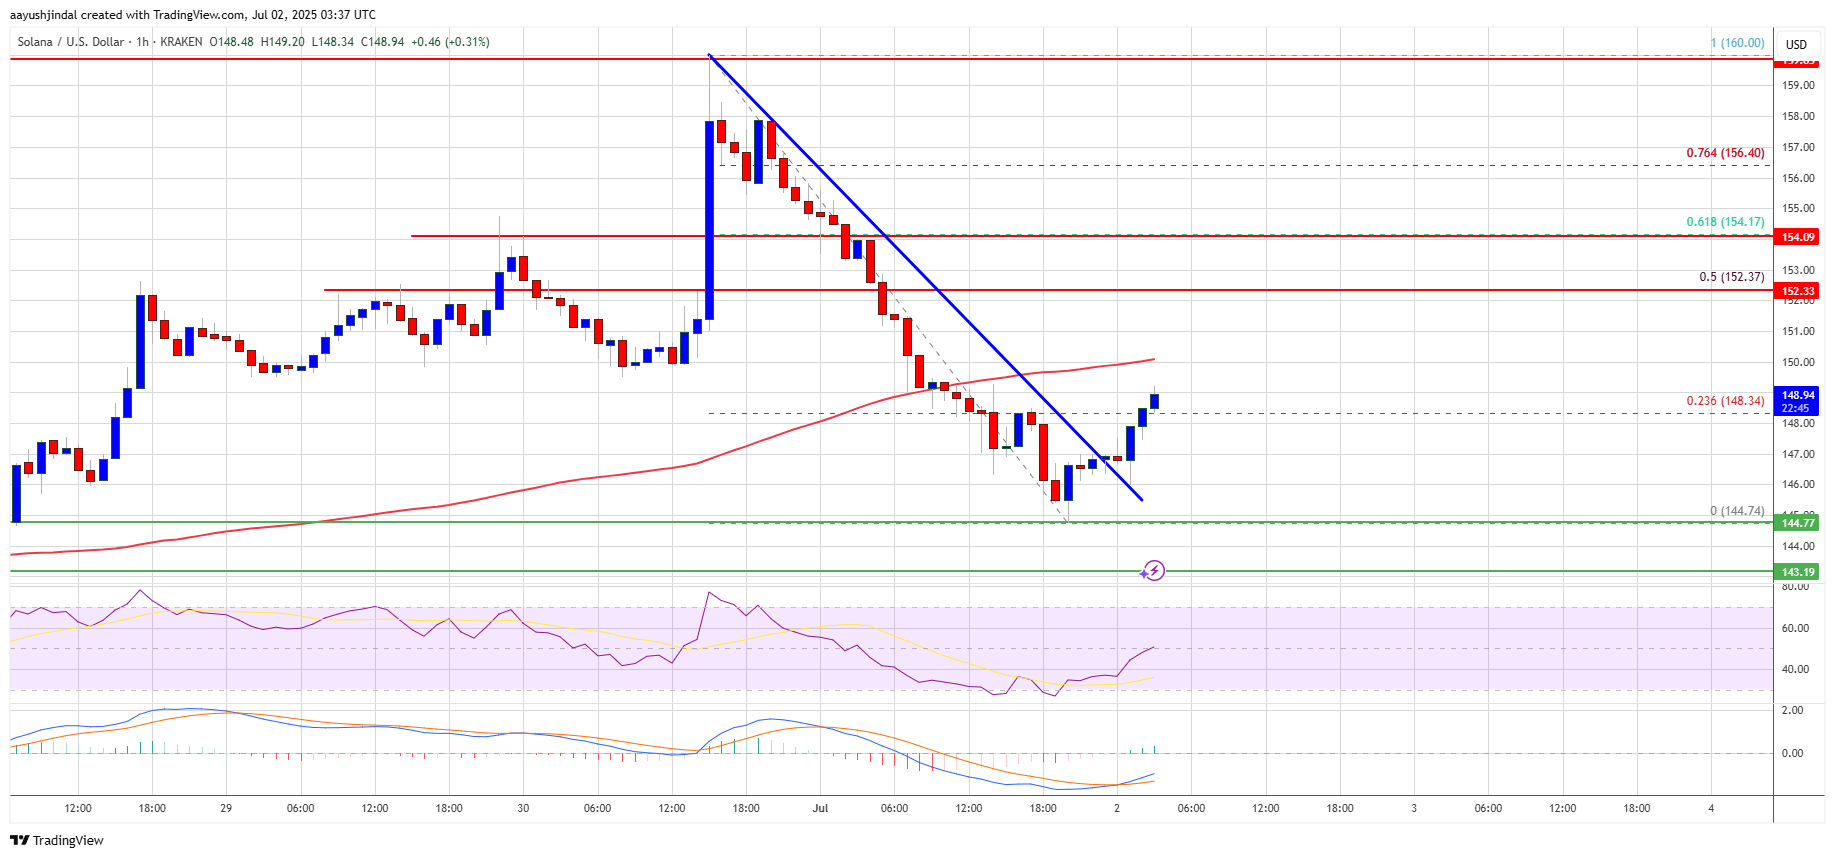
- SOL price started a fresh decline after it failed to clear $160 against the US Dollar.
- The price is now trading below $150 and the 100-hourly simple moving average.
- There was a break above a key bearish trend line with resistance at $147 on the hourly chart of the SOL/USD pair (data source from Kraken).
- The pair could start a fresh increase if it clears the $152 resistance zone.
Solana price struggled to continue higher above $160 and started a fresh decline, like Bitcoin and Ethereum. SOL declined below the $155 and $152 support levels.
It even dipped below $150 and tested the $145 zone. A low was formed at $144 and the price is now correcting some losses. There was a move above the 23.6% Fib retracement level of the downward move from the $160 swing high to the $144 low.
Besides, there was a break above a key bearish trend line with resistance at $147 on the hourly chart of the SOL/USD pair. Solana is now trading below $150 and the 100-hourly simple moving average.
On the upside, the price is facing resistance near the $150 level. The next major resistance is near the $152 level. It is close to the 50% Fib retracement level of the downward move from the $160 swing high to the $144 low. The main resistance could be $155. A successful close above the $155 resistance zone could set the pace for another steady increase. The next key resistance is $160. Any more gains might send the price toward the $165 level.
Another Decline in SOL?If SOL fails to rise above the $150 resistance, it could start another decline. Initial support on the downside is near the $145 zone. The first major support is near the $142 level.
A break below the $142 level might send the price toward the $136 zone. If there is a close below the $136 support, the price could decline toward the $125 support in the near term.
Technical Indicators
Hourly MACD – The MACD for SOL/USD is losing pace in the bearish zone.
Hourly Hours RSI (Relative Strength Index) – The RSI for SOL/USD is above the 50 level.
Major Support Levels – $145 and $142.
Major Resistance Levels – $152 and $155.
Why this matters
This altcoin story adds another data point to the current market tape and is useful when read alongside nearby source coverage.
Original source
Read on NewsBTCRelated market context

Bitcoin (BTC) Price Prediction: BTC Holds $63K Support—Can Rising Active Addresses Offset Bearish Technical Signals?
Although the BTC price has remained near a key support zone, recent chart signals and Strategy’s sale of a portion of its Bitcoin...

VanEck Solana ETF Filing Pushes Altcoin Fund Race Beyond Bitcoin And Ethereum
Solana is now formally in the U.S. spot ETF conversation after a VanEck-linked proposal reached the SEC through a Cboe BZX rule fi...

Vitalik Buterin Proposes ‘Extremely Lean’ Ethereum That Cuts Validator State by 95% Using ZK Proofs
Ethereum co-founder Vitalik Buterin published a technical proposal Monday called “The Extremely Lean Chain,” outlining a two-phase...

Bitcoin needs trillions to go parabolic again as ETF demand fades
Bitcoin’s next major rally may depend less on whether investors still believe in the asset than on whether enough large balance sh...

Bitcoin miner bottom signal now depends on who survives weak mining profits
A Bitcoin miner-stress signal circulating on X has fallen into a zone analysts associate with severe miner pressure, putting a fam...

Bitmine’s Tom Lee ties ether strength to Clarity Act odds as treasury nears 5% of Ethereum’s total supply
Bitmine acquired 42,197 ether worth an estimated $74 million last week, lifting its treasury to over 5.7 million ETH.