Solana (SOL) Breakout Watch: Price Could Rally Hard Above $150 Level?
Solana started a fresh increase from the $125 zone. SOL price is now consolidating gains and aims for more gains above the $150 level. SOL price started a fresh increase above the $132 zone against the US Dollar. The pri...
Archive context
Older archive item. Useful for background and entity history, but not a fresh market-moving signal.

Solana started a fresh increase from the $125 zone. SOL price is now consolidating gains and aims for more gains above the $150 level.
- SOL price started a fresh increase above the $132 zone against the US Dollar.
- The price is now trading above $142 and the 100-hourly simple moving average.
- There is a key bullish trend line forming with support at $142 on the hourly chart of the SOL/USD pair (data source from Kraken).
- The pair could start a fresh increase if it clears the $150 resistance zone.
Solana price remained supported above $125 and started a fresh increase, like Bitcoin and Ethereum. SOL gained pace and traded above the $132 resistance level.
The bulls pushed the price above the $142 and $145 levels. They are now facing hurdles near $148 and $150. A high was formed at $147 and the price is now consolidating gains above the 23.6% Fib retracement level of the upward move from the $126 swing low to the $147 swing high.
Solana is now trading above $142 and the 100-hourly simple moving average. There is also a key bullish trend line forming with support at $142 on the hourly chart of the SOL/USD pair.
On the upside, the price is facing resistance near the $148 level. The next major resistance is near the $150 level. The main resistance could be $155. A successful close above the $155 resistance zone could set the pace for another steady increase. The next key resistance is $160. Any more gains might send the price toward the $165 level.
Another Decline in SOL?If SOL fails to rise above the $150 resistance, it could start another decline. Initial support on the downside is near the $142 zone. The first major support is near the $136 level or the 50% Fib retracement level of the upward move from the $126 swing low to the $147 swing high.
A break below the $136 level might send the price toward the $130 zone. If there is a close below the $130 support, the price could decline toward the $125 support in the near term.
Technical Indicators
Hourly MACD – The MACD for SOL/USD is losing pace in the bullish zone.
Hourly Hours RSI (Relative Strength Index) – The RSI for SOL/USD is above the 50 level.
Major Support Levels – $142 and $136.
Major Resistance Levels – $148 and $150.
Why this matters
This altcoin story adds another data point to the current market tape and is useful when read alongside nearby source coverage.
Original source
Read on NewsBTCRelated market context

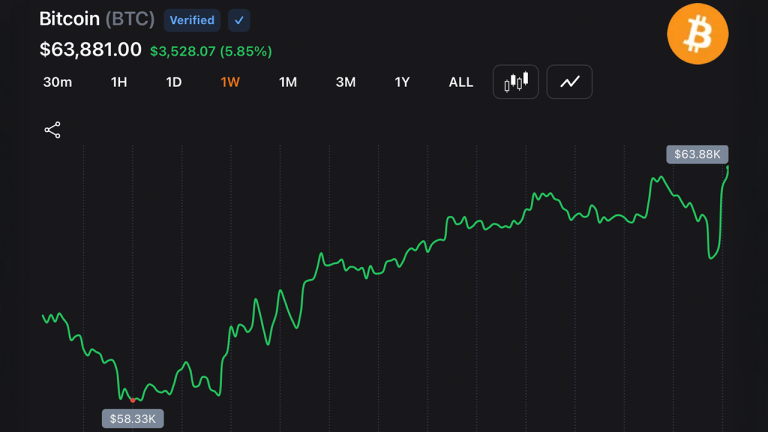
Bitcoin (BTC) Price Prediction: BTC Holds $63K Support—Can Rising Active Addresses Offset Bearish Technical Signals?
Although the BTC price has remained near a key support zone, recent chart signals and Strategy’s sale of a portion of its Bitcoin...

XRP Price Prediction: Volume and ETF Inflow Send Ripple Token Higher
XRP price pushed above the $1.14 resistance area after buyers stepped in with heavy volume and bullish prediction. The token climb...

Ethereum (ETH) Price Prediction: ETH Holds Near $1,780 as Bulls Eye $1,860–$1,950, but $1,609 Remains Key Invalidation
Ethereum price is trading near $1,779 after a mixed 24-hour session, according to Brave New Coin data. ETH is down around 0.76% on...

The CLARITY Act Missed Its July 4 Deadline. Is Crypto Screwed?
There is a version of 2026 in which the United States finally settled the question that has defined a decade of crypto litigation...
Bitcoin Rebounds Above $63,500 After Strategy’s $216M Sale Triggers $214M in Short Liquidations
Bitcoin nearly reached $64,000 over the weekend before a sharp Monday morning drop dragged it to an intraday low of $61,246. It qu...

Bitcoin needs trillions to go parabolic again as ETF demand fades
Bitcoin’s next major rally may depend less on whether investors still believe in the asset than on whether enough large balance sh...