Solana (SOL) Cools After Recovery — Resistance Proving Difficult to Crack
Solana started a recovery wave above the $150 zone. SOL price is now correcting gains and might struggle to rise above the $155 resistance. SOL price started a fresh decline after it failed to clear $155 against the US D...
Archive context
Older archive item. Useful for background and entity history, but not a fresh market-moving signal.

Solana started a recovery wave above the $150 zone. SOL price is now correcting gains and might struggle to rise above the $155 resistance.
- SOL price started a fresh decline after it failed to clear $155 against the US Dollar.
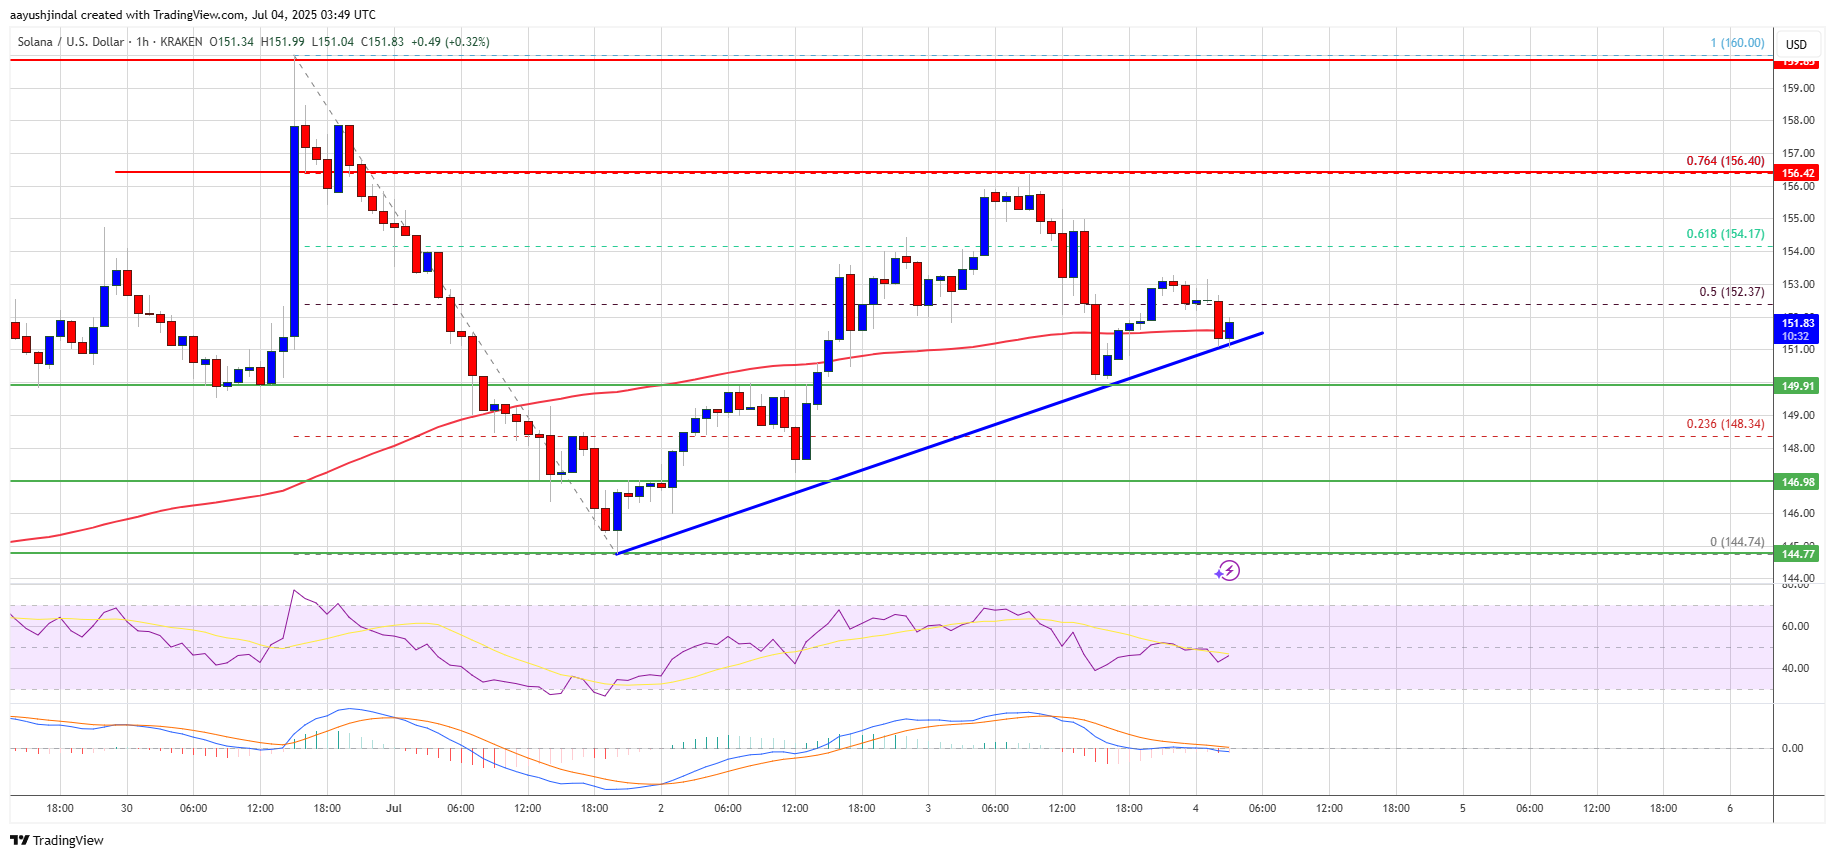
- The price is now trading near $152 and the 100-hourly simple moving average.
- There is a key bullish trend line forming with support at $151 on the hourly chart of the SOL/USD pair (data source from Kraken).
- The pair could start a fresh increase if it clears the $156 resistance zone.
Solana price started a decent increase after it cleared the $150 resistance, like Bitcoin and Ethereum. SOL climbed above the $152 level to enter a short-term positive zone. There was a move above the 50% Fib retracement level of the downward move from the $160 swing high to the $144 low.
However, the bears were active near the $156 resistance. They protected a move above the 76.4% Fib retracement level of the downward move from the $160 swing high to the $144 low.
The price is now moving lower and trading below the $154 level. Solana is now trading near $152 and the 100-hourly simple moving average. There is also a key bullish trend line forming with support at $151 on the hourly chart of the SOL/USD pair.
On the upside, the price is facing resistance near the $155 level. The next major resistance is near the $156 level. The main resistance could be $160. A successful close above the $160 resistance zone could set the pace for another steady increase. The next key resistance is $162. Any more gains might send the price toward the $165 level.
Another Decline in SOL?If SOL fails to rise above the $155 resistance, it could start another decline. Initial support on the downside is near the $150 zone. The first major support is near the $146 level.
A break below the $146 level might send the price toward the $142 zone. If there is a close below the $142 support, the price could decline toward the $136 support in the near term.
Technical Indicators
Hourly MACD – The MACD for SOL/USD is losing pace in the bullish zone.
Hourly Hours RSI (Relative Strength Index) – The RSI for SOL/USD is below the 50 level.
Major Support Levels – $150 and $146.
Major Resistance Levels – $155 and $160.
Why this matters
This altcoin story adds another data point to the current market tape and is useful when read alongside nearby source coverage.
Original source
Read on NewsBTCRelated market context

Bitcoin (BTC) Price Prediction: BTC Holds $63K Support—Can Rising Active Addresses Offset Bearish Technical Signals?
Although the BTC price has remained near a key support zone, recent chart signals and Strategy’s sale of a portion of its Bitcoin...

Sui DeFi TVL Breaks $1 Billion As Move-Based Chains Fight For Liquidity
Sui has crossed the $1 billion total value locked mark on DeFiLlama, giving the Move-based network a clearer claim to serious DeFi...

VanEck Solana ETF Filing Pushes Altcoin Fund Race Beyond Bitcoin And Ethereum
Solana is now formally in the U.S. spot ETF conversation after a VanEck-linked proposal reached the SEC through a Cboe BZX rule fi...

Bitcoin miner bottom signal now depends on who survives weak mining profits
A Bitcoin miner-stress signal circulating on X has fallen into a zone analysts associate with severe miner pressure, putting a fam...

Bitcoin Price Prediction: Peter Brandt Might Dump BTC for Gold
Bitcoin is facing a test, and its price prediction is not helping. So far in 2026, BTC has fallen about 28%, while gold is down ju...

New SummerFi DeFi exploit shows AI automation now sits above smart contract risk
Summer.fi's automated vault incident has put delegated DeFi yield back under pressure after Blockaid said on July 6 that its explo...