Solana (SOL) Defends Critical Support Zone, Preparing for Next Major Increase?
Solana started a fresh increase above the $185 zone. SOL price is now consolidating above $190 and might aim for more gains above the $200 zone. SOL price started a fresh upward move above the $185 and $192 levels agains...
Archive context
Older archive item. Useful for background and entity history, but not a fresh market-moving signal.

Solana started a fresh increase above the $185 zone. SOL price is now consolidating above $190 and might aim for more gains above the $200 zone.
- SOL price started a fresh upward move above the $185 and $192 levels against the US Dollar.
- The price is now trading above $190 and the 100-hourly simple moving average.
- There was a break below a bullish trend line with support at $202 on the hourly chart of the SOL/USD pair (data source from Kraken).
- The pair could extend gains if it clears the $198 resistance zone.
Solana price started a decent increase after it found support near the $185 zone, like Bitcoin and Ethereum. SOL climbed above the $192 level to enter a short-term positive zone.
The price even smashed the $200 resistance. The bulls were able to push the price above the $202 barrier. A high was formed at $210 and the price recently corrected gains below the 23.6% Fib retracement level of the upward move from the $174 swing low to the $210 high.
There was a break below a bullish trend line with support at $202 on the hourly chart of the SOL/USD pair. However, the bulls were active near the $188 level and the 61.8% Fib retracement level of the upward move from the $174 swing low to the $210 high.
Solana is now trading above $190 and the 100-hourly simple moving average. On the upside, the price is facing resistance near the $198 level. The next major resistance is near the $200 level.
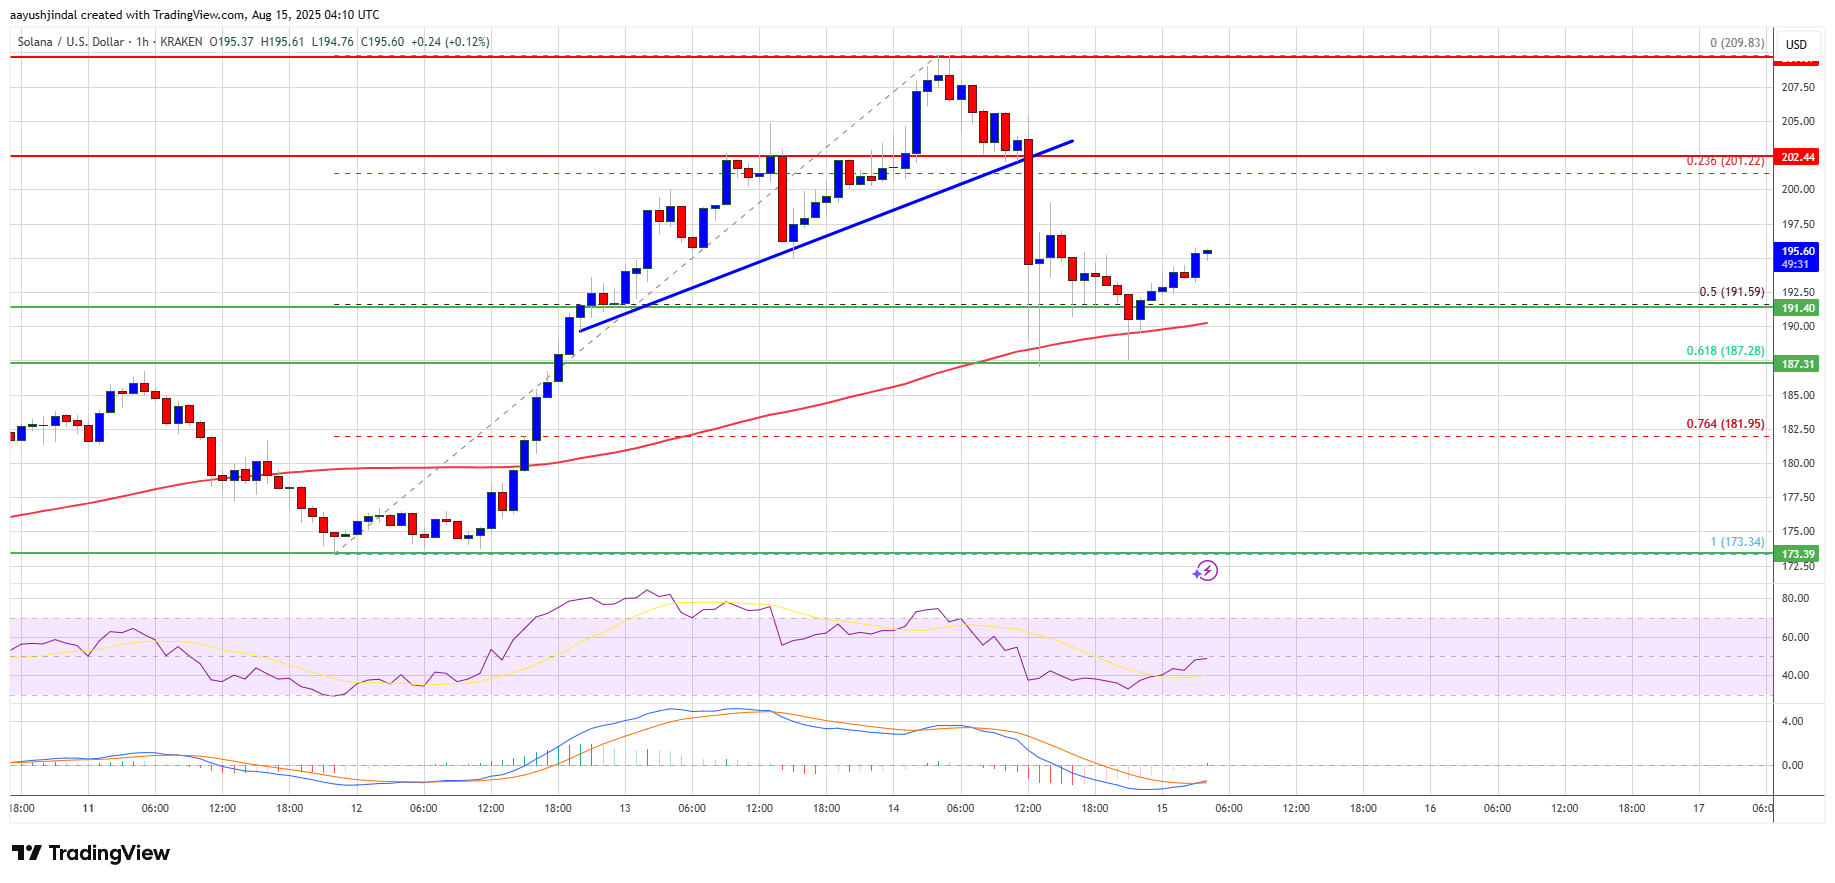
The main resistance could be $202. A successful close above the $202 resistance zone could set the pace for another steady increase. The next key resistance is $210. Any more gains might send the price toward the $220 level.
Another Decline In SOL?If SOL fails to rise above the $200 resistance, it could start another decline. Initial support on the downside is near the $192 zone. The first major support is near the $188 level.
A break below the $188 level might send the price toward the $180 support zone. If there is a close below the $180 support, the price could decline toward the $175 support in the near term.
Technical Indicators
Hourly MACD – The MACD for SOL/USD is losing pace in the bullish zone.
Hourly Hours RSI (Relative Strength Index) – The RSI for SOL/USD is below the 50 level.
Major Support Levels – $192 and $188.
Major Resistance Levels – $200 and $210.
Why this matters
This altcoin story adds another data point to the current market tape and is useful when read alongside nearby source coverage.
Original source
Read on NewsBTCRelated market context

Ethereum Price Hits $2,500 Resistance Wall as Fear and Greed Reaches Extreme Levels
Ethereum trades at $2,450 as it continues probing the $2,500 price ceiling it’s failed to convincingly break for the third straigh...

NEAR Protocol becomes first major blockchain with post-quantum key support
NEAR's adoption of post-quantum cryptography sets a precedent for blockchain security, potentially safeguarding digital assets aga...

Ethereum (ETH) Price Prediction: ETH Holds $2,400 Breakout as Bulls Target $2,600 and $2,823
Ethereum price has quietly worked its way back into an important part of the chart after a strong recovery from recent lows. The p...

Dealer Hedging Puts Bitcoin $80,000 Zone in Focus
Bitcoin traders face a $6.44 billion options expiry on Deribit at 08:00 UTC this Friday, covering 81,700 BTC contracts as spot hov...

Bitcoin traders hedged $60k and loaded up above $78k leaving the low $70k exposed
Bitcoin's end-of-September options expiry holds 130,670 BTC of open interest, compared with 79,003 BTC for August, a headline gap...

XRP Soars, But What’s Really Happening? Can Ripple Blast Past $10 This Year?
XRP is trading at $1.41, down 2% over the past 24 hours in a mild pullback after one of the sharpest weekly moves in the top-10. T...