Solana (SOL) Dives Nearly 10%: Market Reactions and Future Outlook
Solana failed to climb above the $135 resistance. SOL price started another decline, dropping nearly 10%, and now the bears aim for more downsides. SOL price remained in a bearish zone below the $142 resistance against t...

Solana failed to climb above the $135 resistance. SOL price started another decline, dropping nearly 10%, and now the bears aim for more downsides.
- SOL price remained in a bearish zone below the $142 resistance against the US Dollar.
- The price is now trading below $130 and the 100-hourly simple moving average.
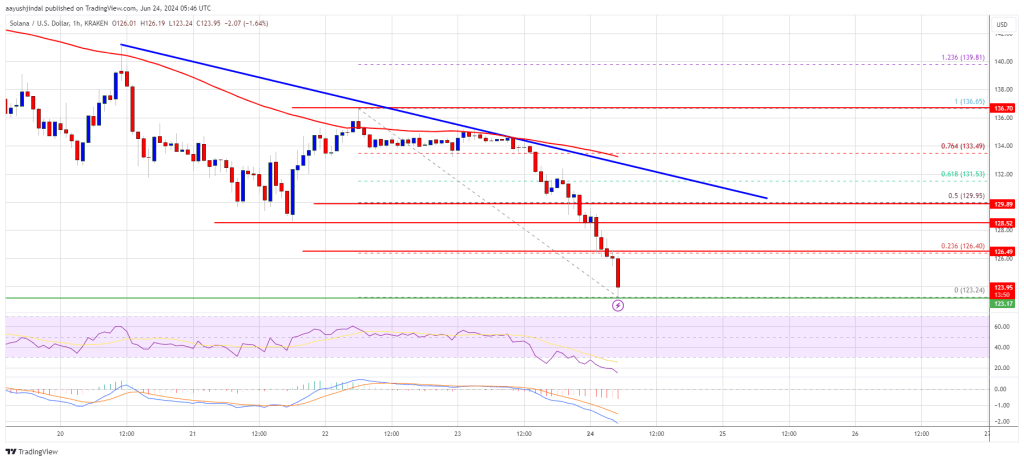
- There is a connecting bearish trend line forming with resistance at $130 on the hourly chart of the SOL/USD pair (data source from Kraken).
- The pair could extend losses if there is a close below the $122.50 support zone.
Solana price attempted a recovery wave above the $132 level. However, SOL bears defended upsides above the $135 level and the price started another decline like Bitcoin and Ethereum.
There was a drop below the $130 and $125 support levels. A low was formed at $123.24 and the price is currently trading in a downtrend. There is also a connecting bearish trend line forming with resistance at $130 on the hourly chart of the SOL/USD pair.
Solana is now trading below $130 and the 100-hourly simple moving average. If there is a recovery wave, the price might face resistance near the $126.50 level or the 23.6% Fib retracement level of the downward move from the $136.65 swing high to the $123.24 low.
Immediate resistance is near the $128.50 level. The next major resistance is near the $130.00 level or the trend line. It is close to the 50% Fib retracement level of the downward move from the $136.65 swing high to the $123.24 low.
A successful close above the $130.00 resistance could set the pace for another steady increase. The next key resistance is near $132.50. Any more gains might send the price toward the $136.50 level.
More Losses in SOL?If SOL fails to recover above the $130.00 resistance, it could start another decline. Initial support on the downside is near the $123.50 level.
The first major support is near the $122.00 level, below which the price could test $120.00. If there is a close below the $120.00 support, the price could decline toward the $112.50 support in the near term.
Technical Indicators
Hourly MACD – The MACD for SOL/USD is gaining pace in the bearish zone.
Hourly Hours RSI (Relative Strength Index) – The RSI for SOL/USD is below the 20 level.
Major Support Levels – $122.00, and $120.00.
Major Resistance Levels – $126.50, $130.00, and $132.50.
Original source
Read on NewsBTCRelated market context

Uranium Holds Above $85 as Mining ETF Rebounds From June Sell-Off
The latest charts display that the market is divided into stable physical prices and uranium shares trying to regain momentum afte...

Elon Musk’s trillionaire status puts his net worth above crypto’s entire market cap outside Bitcoin
Elon Musk has become the first person in modern history to amass a personal net worth exceeding $1 trillion, crossing the historic...

Bitcoin rises above $64,000 after Pakistan prime minister says Iran peace deal is near
Bitcoin traded above $64,000 on Saturday, supported by its strongest ETF inflows in a month and growing optimism around geopolitic...

Standard Chartered Says Bitcoin Bottomed Near $59,000 As Crypto Winter Ends
TL;DR Standard Chartered’s Geoffrey Kendrick reportedly says Bitcoin’s $59,000 area marked the cycle bottom. The note cites SpaceX...

US forces shoot down Iranian attack drones near Strait of Hormuz, Bitcoin drops below $73K
Geopolitical tensions near vital oil routes can destabilize financial markets, highlighting the interconnectedness of global secur...

Bitcoin price faces new risk as big buyers lose conviction
Bitcoin’s largest buyers are no longer behaving like a reliable backstop for the largest cryptocurrency. The exchange-traded funds...