Solana (SOL) Drifts Lower, Is a Drop Below $85 Now Imminent?
Solana failed to settle above $92 and extended losses. SOL price is now consolidating losses below $90 and might struggle to start a recovery wave. SOL price started a fresh decline below $90 and $88 against the US Dolla...
Archive context
Older archive item. Useful for background and entity history, but not a fresh market-moving signal.

Solana failed to settle above $92 and extended losses. SOL price is now consolidating losses below $90 and might struggle to start a recovery wave.
- SOL price started a fresh decline below $90 and $88 against the US Dollar.
- The price is now trading below $88 and the 100-hourly simple moving average.
- There is a key bearish trend line forming with resistance at $88 on the hourly chart of the SOL/USD pair (data source from Kraken).
- The price could start a recovery wave if the bulls defend $85 or $80.
Solana price failed to remain stable above $92 and started a fresh decline, like Bitcoin and Ethereum. SOL declined below the $90 and $88 support levels.
The price gained bearish momentum below $87.20. A low was formed at $85.10, and the price is now consolidating losses below the 23.6% Fib retracement level of the downward move from the $90.81 swing high to the $85.10 low.
Solana is now trading below $88 and the 100-hourly simple moving average. On the upside, immediate resistance is near the $88 level. There is also a key bearish trend line forming with resistance at $88 on the hourly chart of the SOL/USD pair.
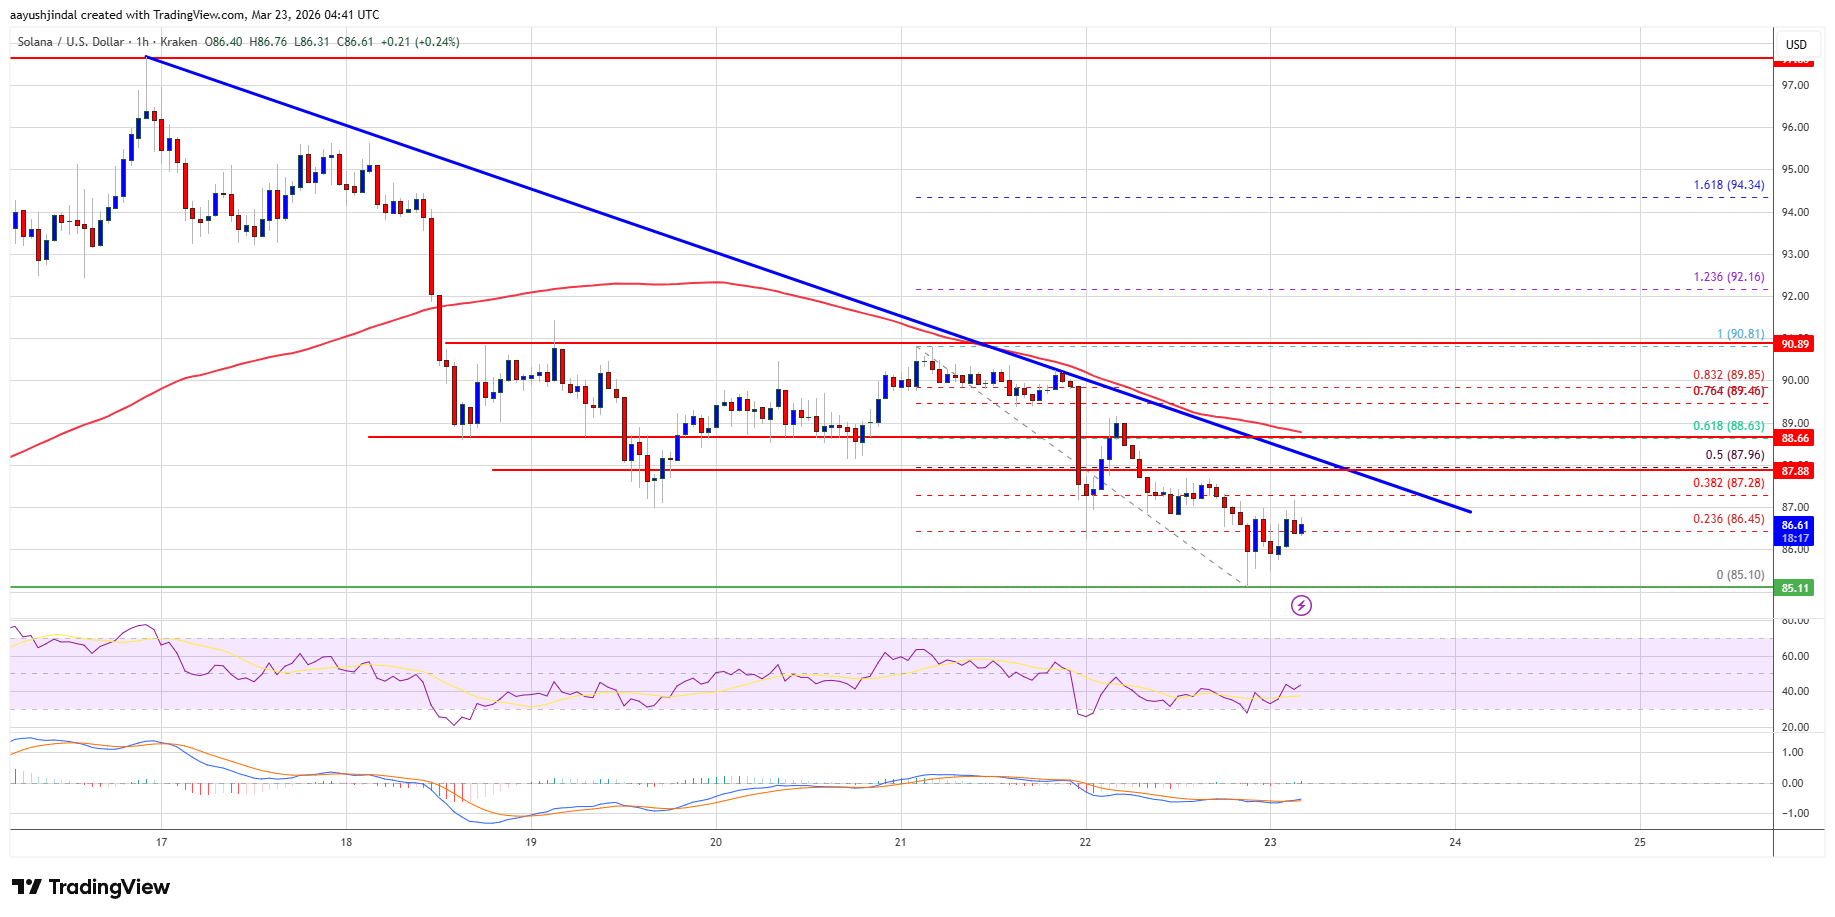
The next major resistance is near the $88.60 level or the 61.8% Fib retracement level of the downward move from the $90.81 swing high to the $85.10 low. The main resistance could be $90. A successful close above the $90 resistance zone could set the pace for another steady increase. The next key resistance is $95. Any more gains might send the price toward the $102 level.
More Losses In SOL?If SOL fails to rise above the $88 resistance, it could continue to move down. Initial support on the downside is near the $85 zone. The first major support is near the $82 level.
A break below the $82 level might send the price toward the $80 support zone. If there is a close below the $80 support, the price could decline toward the $74 support in the near term.
Technical Indicators
Hourly MACD – The MACD for SOL/USD is gaining pace in the bearish zone.
Hourly Hours RSI (Relative Strength Index) – The RSI for SOL/USD is below the 50 level.
Major Support Levels – $85 and $80.
Major Resistance Levels – $88 and $90.
Why this matters
Solana is a tracked market entity in the DigitalMoneyBox archive, making this useful context for readers monitoring repeated mentions and follow-up coverage.
Original source
Read on NewsBTCRelated market context
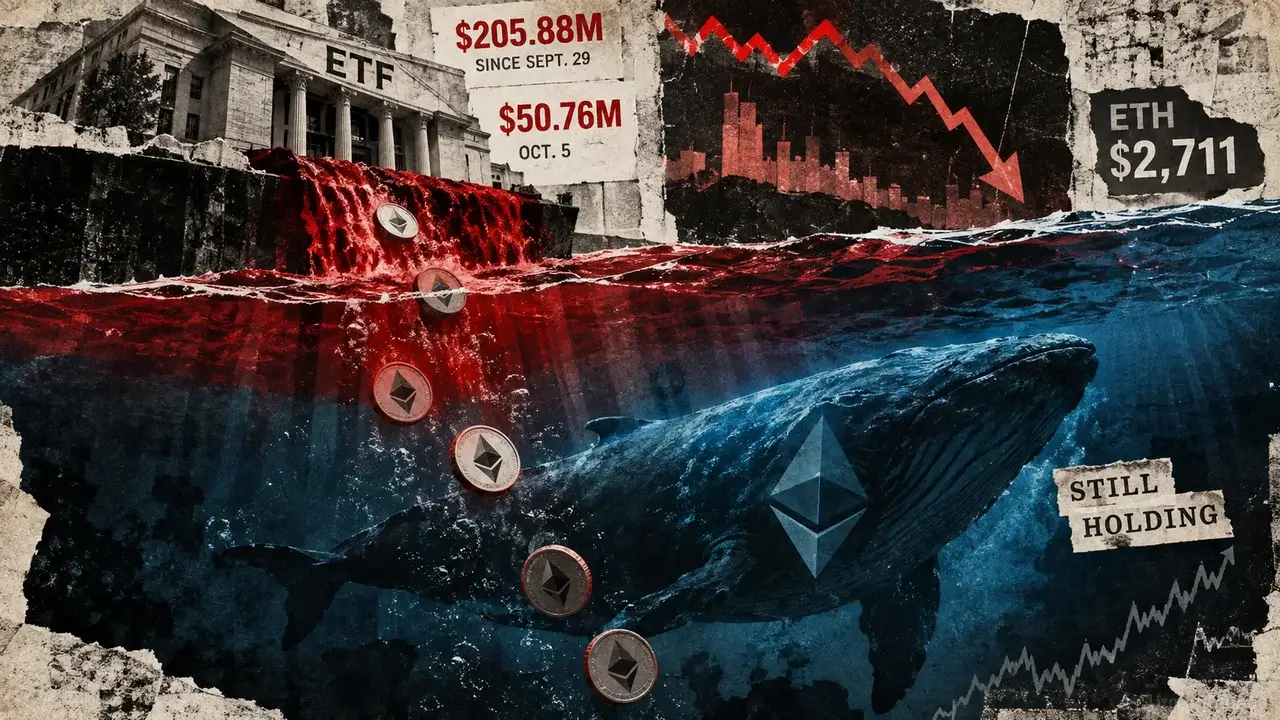
Ethereum bears keep selling but ETH price stays near $2,700 as US spot ETFs record $206M in outflows
Ethereum’s institutional demand is weakening around the same time derivatives positioning shows traders are selling aggressively w...

Ethereum Price Prediction: Last-Minute Glamsterdam Fix Sets Stage for 200M Gas Jump
Ethereum trades at just under $2,700 as validators prepare for Glamsterdam’s Sepolia activation, which could lift its price predic...

Ethereum’s proposed 3x ETF could reach CME’s futures threshold with just $362 million
At ETHU's Oct. 6 disclosed futures valuation, a 3x Ethereum ETF with $362.1 million in assets would target about $1.09 billion of...

Ethereum Economic Zone executes first atomic L1-to-L2 transaction on mainnet
This milestone could enhance Ethereum's scalability and liquidity, fostering innovation but requires careful consideration of cont...

XRP Price Prediction: Chart Mirroring 2016, Targeting $23
XRP trades at around the $1.50 price level, slightly down, but a long-range chart comparison points to a $23 prediction. The resem...

Bitcoin and Solana spot ETFs see net outflows as Ethereum records inflows
Shifting investor sentiment towards Bitcoin may increase market volatility, challenging Ethereum's position and impacting altcoin...