Solana (SOL) Eyes a Strong Comeback: Will the Rally Ignite a Surge?
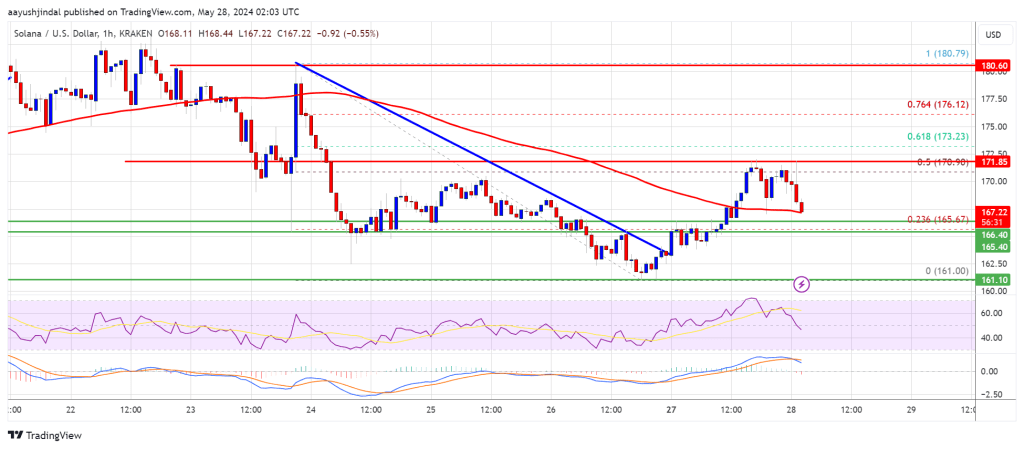
Solana found support near the $160 zone. SOL price is slowly rising and might gain bullish momentum if it clears the $172 resistance zone. SOL price corrected lower and tested the $160 support zone against the US Dollar....
Archive context
Older archive item. Useful for background and entity history, but not a fresh market-moving signal.

Solana found support near the $160 zone. SOL price is slowly rising and might gain bullish momentum if it clears the $172 resistance zone.
- SOL price corrected lower and tested the $160 support zone against the US Dollar.
- The price is now trading above $165 and the 100-hourly simple moving average.
- There was a break above a key bearish trend line with resistance at $164 on the hourly chart of the SOL/USD pair (data source from Kraken).
- The pair could clear the $172 resistance unless it fails to stay above $165.
Solana price formed a support base near the $160 level and started a recovery wave. SOL underperformed Bitcoin and Ethereum but managed to clear the $165 resistance.
There was a break above a key bearish trend line with resistance at $164 on the hourly chart of the SOL/USD pair. There was even a spike above the $170 zone and the 50% Fib retracement level of the downward move from the $181 swing high to the $160 low.
Solana price is now trading above $165 and the 100-hourly simple moving average. Immediate resistance is near the $170 level. The next major resistance is near the $171 level. A successful close above the $172 resistance could set the pace for another major increase.
The next key resistance is near $176 or the 76.4% Fib retracement level of the downward move from the $181 swing high to the $160 low. Any more gains might send the price toward the $180 level.
Are Dips Supported in SOL?If SOL fails to rally above the $172 resistance, it could start another decline. Initial support on the downside is near the $167 level.
The first major support is near the $165 level, below which the price could test $160. If there is a close below the $160 support, the price could decline toward the $150 support in the near term.
Technical Indicators
Hourly MACD – The MACD for SOL/USD is losing pace in the bullish zone.
Hourly Hours RSI (Relative Strength Index) – The RSI for SOL/USD is below the 50 level.
Major Support Levels – $165, and $160.
Major Resistance Levels – $170, $172, and $180.
Why this matters
This altcoin story adds another data point to the current market tape and is useful when read alongside nearby source coverage.
Original source
Read on NewsBTCRelated market context

Leading Claude AI Fable 5 Predicts Stunning XRP Price by The End of 2026
Anthropic’s new Claude AI model, Fable 5, predicts XRP price for the entire second half around a single event that could be resolv...

Mark Zuckerberg’s Meta AI Predicts Unbelievable Bitcoin Price by the End of 2026
Mark Zuckerberg’s Meta AI predicts and stacks 4 numbered catalysts behind its Bitcoin price prediction that puts $120,000 to $150,...

Bitcoin whales send 49,000 BTC to exchanges as $60K rebound shows signs of weakness
Bitcoin’s recovery above $60,000 is facing a fresh test from exchange-flow and derivatives data after large holders moved one of t...
Solana hits usage peak as SOL price climbs above $80
Solana's rising usage and SOL price surge could signal increased investor confidence, potentially influencing broader crypto marke...
Former Blackrock Executive Defends Ethereum as Solana’s Validator Count Shrinks to 800
Sharplink co-CEO Joseph Chalom, a former Blackrock executive, has pushed back on claims that Ethereum has a “culture problem,” arg...

Bitcoin Price Eyes Recovery After END-OF-CYCLE STRC Shock, Bitwise CIO Says Strategy Will Be ‘Less Important’ Next BTC Cycle
While improving macroeconomic conditions have supported a modest Bitcoin price rebound, Bitwise Chief Investment Officer Matt Houg...