Solana (SOL) Faces Bearish Setup — Price Could Resume Decline If $175 Breaks
Solana started a fresh decline from the $208 zone. SOL price is now consolidating losses below $200 and might decline further below $182. SOL price started a fresh decline below $212 and $200 against the US Dollar. The p...

Solana started a fresh decline from the $208 zone. SOL price is now consolidating losses below $200 and might decline further below $182.
- SOL price started a fresh decline below $212 and $200 against the US Dollar.
- The price is now trading below $200 and the 100-hourly simple moving average.
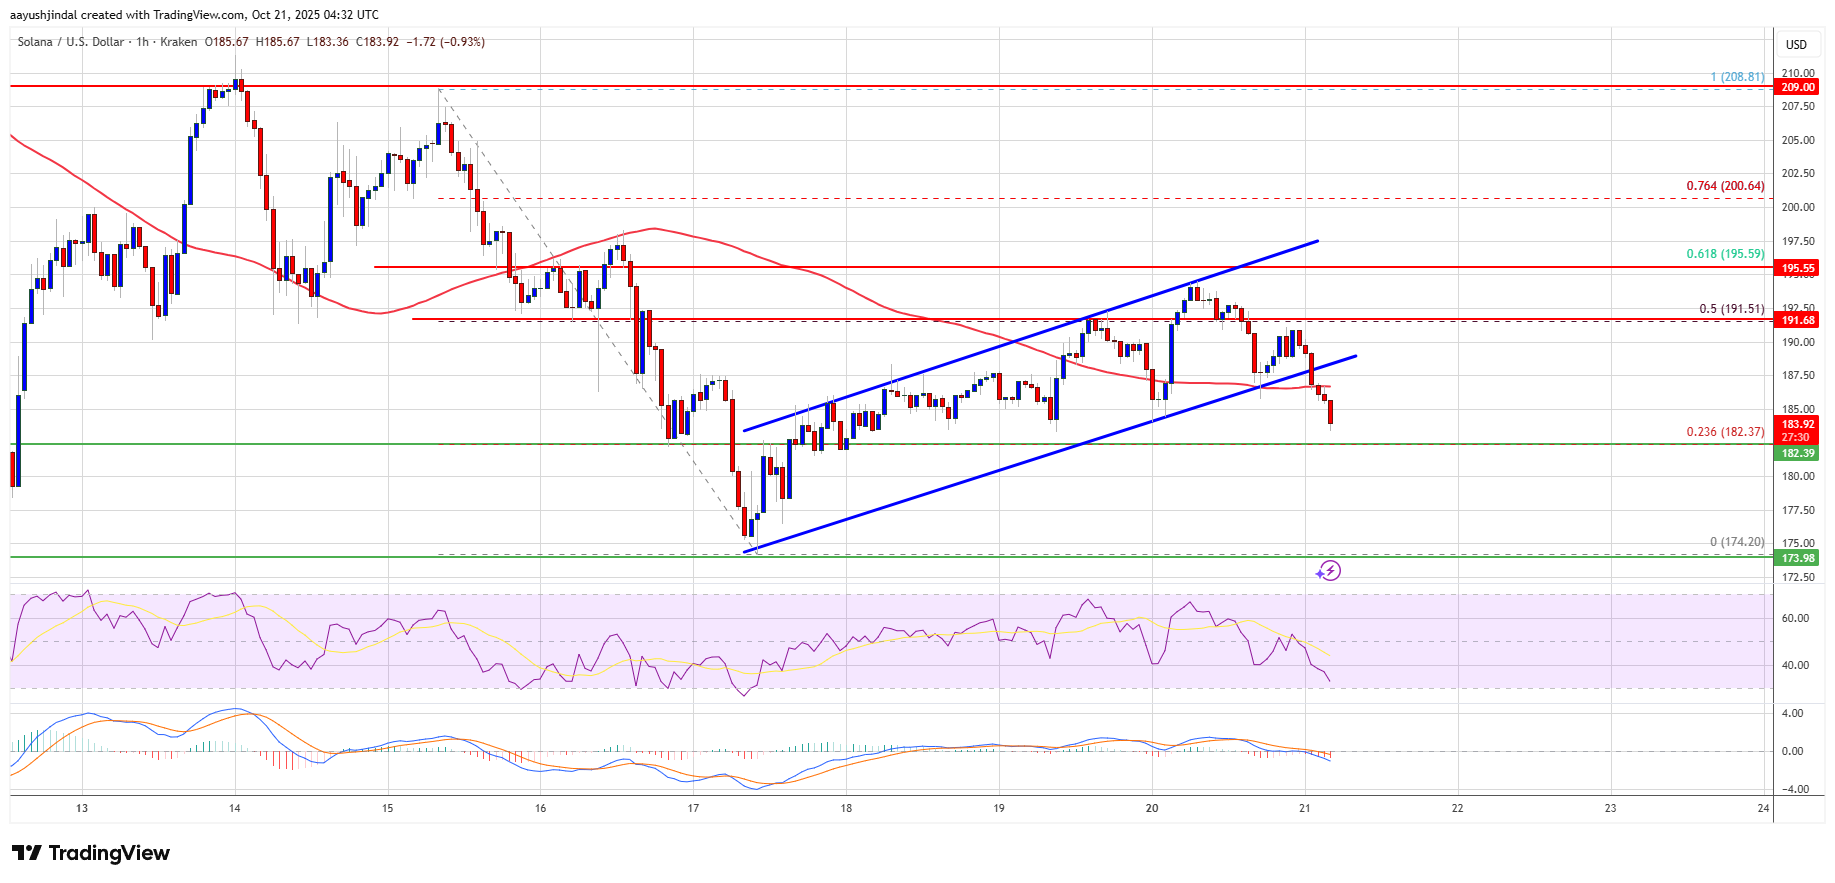
- There was a break below a key rising channel with support at $188 on the hourly chart of the SOL/USD pair (data source from Kraken).
- The price could start another increase if the bulls defend $182 or $175.
Solana price extended gains above $200 and $202, like Bitcoin and Ethereum. SOL even surpassed $210 before the bears appeared. A high was formed near $208 and the price dropped.
There was a move below $200 and $182. A low was formed at $174, and the price recently attempted a minor recovery wave. It climbed above the 50% Fib retracement level of the downward move from the $208 swing high to the $174 low.
However, the bears remained active below $195. They protected the 61.8% Fib retracement level of the downward move from the $208 swing high to the $174 low. SOL is again moving below $190. Besides, there was a break below a key rising channel with support at $188 on the hourly chart of the SOL/USD pair.
Solana is now trading below $188 and the 100-hourly simple moving average. If there is a recovery wave, the price could face resistance near the $188 level. The next major resistance is near the $195 level.
The main resistance could be $200. A successful close above the $200 resistance zone could set the pace for another steady increase. The next key resistance is $208. Any more gains might send the price toward the $215 level.
Downside Continuation In SOL?If SOL fails to rise above the $195 resistance, it could continue to move down. Initial support on the downside is near the $182 zone. The first major support is near the $175 level.
A break below the $175 level might send the price toward the $165 support zone. If there is a close below the $165 support, the price could decline toward the $150 support in the near term.
Technical Indicators
Hourly MACD – The MACD for SOL/USD is gaining pace in the bearish zone.
Hourly Hours RSI (Relative Strength Index) – The RSI for SOL/USD is below the 50 level.
Major Support Levels – $182 and $175.
Major Resistance Levels – $195 and $200.
Original source
Read on NewsBTCRelated market context

Bitcoin (BTC) Price Prediction: BTC Eyes $70K Liquidity Sweep as Whales Reclaim Control Near $62K
Market data suggests that long-term holders remain largely inactive, while whale activity is beginning to recover, creating an int...

Ethereum Price Prediction: 3 Million ETH Rushes Into Staking as Sellers Vanish
Is nobody leaving Ethereum? A record 36 million ETH is now locked in staking, roughly 29–30% of the circulating supply, and the va...

XRP Price Prediction: Japan Regulates Crypto like Stocks, XRP to Benefit First
Japan just rewrote the rules. XRP price is battling below resistance at $1.10, but it’s prediction is getting bullish as Japan’s p...

Ethereum Nears 200 Million Non-Empty Wallets Despite Market Uncertainty
Despite persistent market uncertainty and bearish sentiment across parts of the cryptocurrency sector, Ethereum is approaching a s...

Ethereum Futures Just Hit A Binance Record: Are Traders Calling The Bottom?
Ethereum derivatives activity is flashing a fresh signal on Binance, where open interest measured in ETH terms has reached a new a...

XRP Price Prediction: Japan XRP ETF Listing is Getting Closer
Japan just handed XRP bulls a major regulatory tailwind. XRP price is retesting a congestion zone, and the prediction could turn b...