Solana (SOL) Faces Renewed Selling — Will Support Levels Hold?
Solana started a fresh decline from the $180 zone. SOL price is now moving lower and might decline further below the $160 level. SOL price started a fresh decline from the $180 resistance zone against the US Dollar. The...
Archive context
Older archive item. Useful for background and entity history, but not a fresh market-moving signal.

Solana started a fresh decline from the $180 zone. SOL price is now moving lower and might decline further below the $160 level.
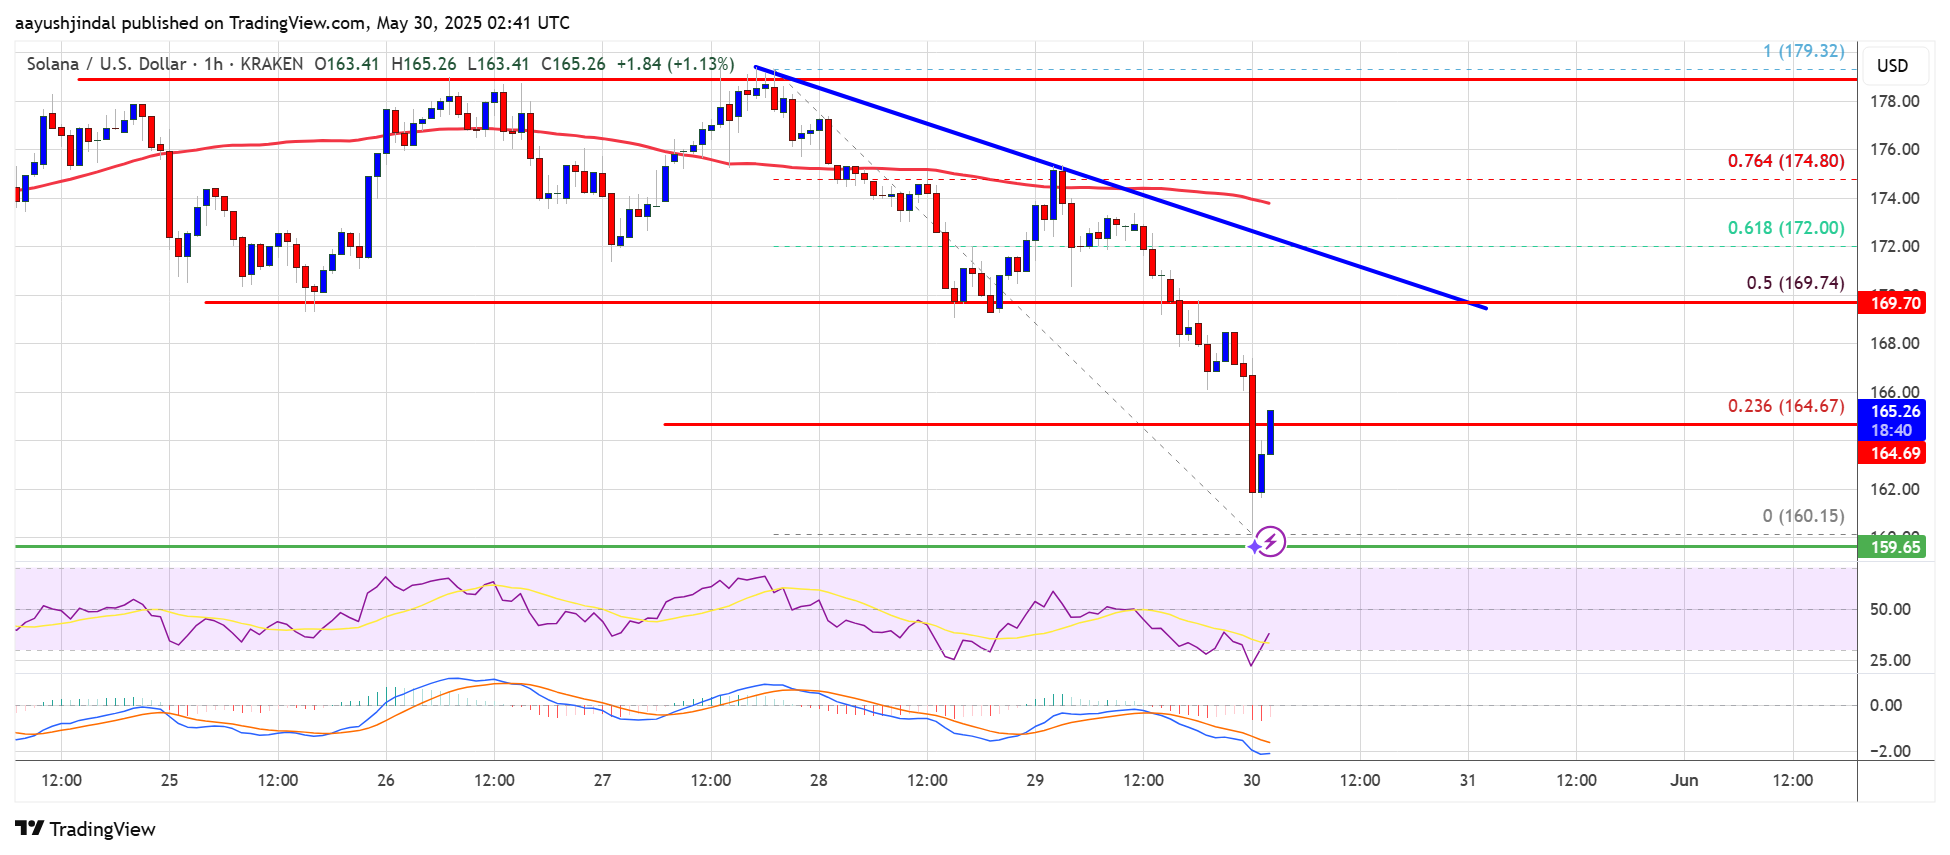
- SOL price started a fresh decline from the $180 resistance zone against the US Dollar.
- The price is now trading below $170 and the 100-hourly simple moving average.
- There is a connecting bearish trend line forming with resistance at $170 on the hourly chart of the SOL/USD pair (data source from Kraken).
- The pair could start a fresh increase if it clears the $170 resistance zone.
Solana price failed to continue higher above the $180 level and started a fresh decline, unlike Bitcoin and Ethereum. SOL gained pace and traded below the $170 support level.
The price even traded below the $162 level. A low was formed near $160 and the price recently started a recovery wave. There was a move above the $165 level. It surpassed the 23.6% Fib retracement level of the recent decline from the $180 swing high to the $160 low.
Solana is now trading below $170 and the 100-hourly simple moving average. There is also a connecting bearish trend line forming with resistance at $170 on the hourly chart of the SOL/USD pair.
On the upside, the price is facing resistance near the $169 level and the trend line. It is close to the 50% Fib retracement level of the recent decline from the $180 swing high to the $160 low. The next major resistance is near the $172 level.
The main resistance could be $180. A successful close above the $180 resistance zone could set the pace for another steady increase. The next key resistance is $185. Any more gains might send the price toward the $200 level.
Another Decline in SOL?If SOL fails to rise above the $170 resistance, it could start another decline. Initial support on the downside is near the $162 zone. The first major support is near the $160 level.
A break below the $160 level might send the price toward the $155 zone. If there is a close below the $155 support, the price could decline toward the $142 support in the near term.
Technical Indicators
Hourly MACD – The MACD for SOL/USD is gaining pace in the bearish zone.
Hourly Hours RSI (Relative Strength Index) – The RSI for SOL/USD is below the 50 level.
Major Support Levels – $162 and $160.
Major Resistance Levels – $170 and $172.
Why this matters
This altcoin story adds another data point to the current market tape and is useful when read alongside nearby source coverage.
Original source
Read on NewsBTCRelated market context

Solana Price Prediction: SOL Holds Near $81 as Breakout Setup Points to $87, but Whale Flows Keep Risk Active
Solana price is back in focus after a sharp recovery pushed SOL towards the $81 area. The move has improved short-term momentum, e...

Mark Zuckerberg’s Meta AI Predicts Unbelievable Bitcoin Price by the End of 2026
Mark Zuckerberg’s Meta AI predicts and stacks 4 numbered catalysts behind its Bitcoin price prediction that puts $120,000 to $150,...

Leading Claude AI Fable 5 Predicts Stunning XRP Price by The End of 2026
Anthropic’s new Claude AI model, Fable 5, predicts XRP price for the entire second half around a single event that could be resolv...

Hyperliquid (HYPE) Price Prediction: Symmetrical Triangle Breakout Puts $77 Target Back in Focus
The breakout comes after several sessions of price compression, with HYPE continuing to trade within a broader technical structure...

Vitalik Buterin unveils “Lean Ethereum” roadmap for quantum resistance by 2029
Ethereum's proactive roadmap enhances its resilience and appeal, potentially boosting market confidence and investment in its futu...

Micron stock soars nearly 700% in a year as tokenized version trades on Ethereum via Ondo
Micron's stock surge and tokenization highlight the growing intersection of traditional finance and decentralized finance, impacti...