Solana (SOL) Gears Up For Another Rally Attempt — Can Bulls Clear $92 Barrier?
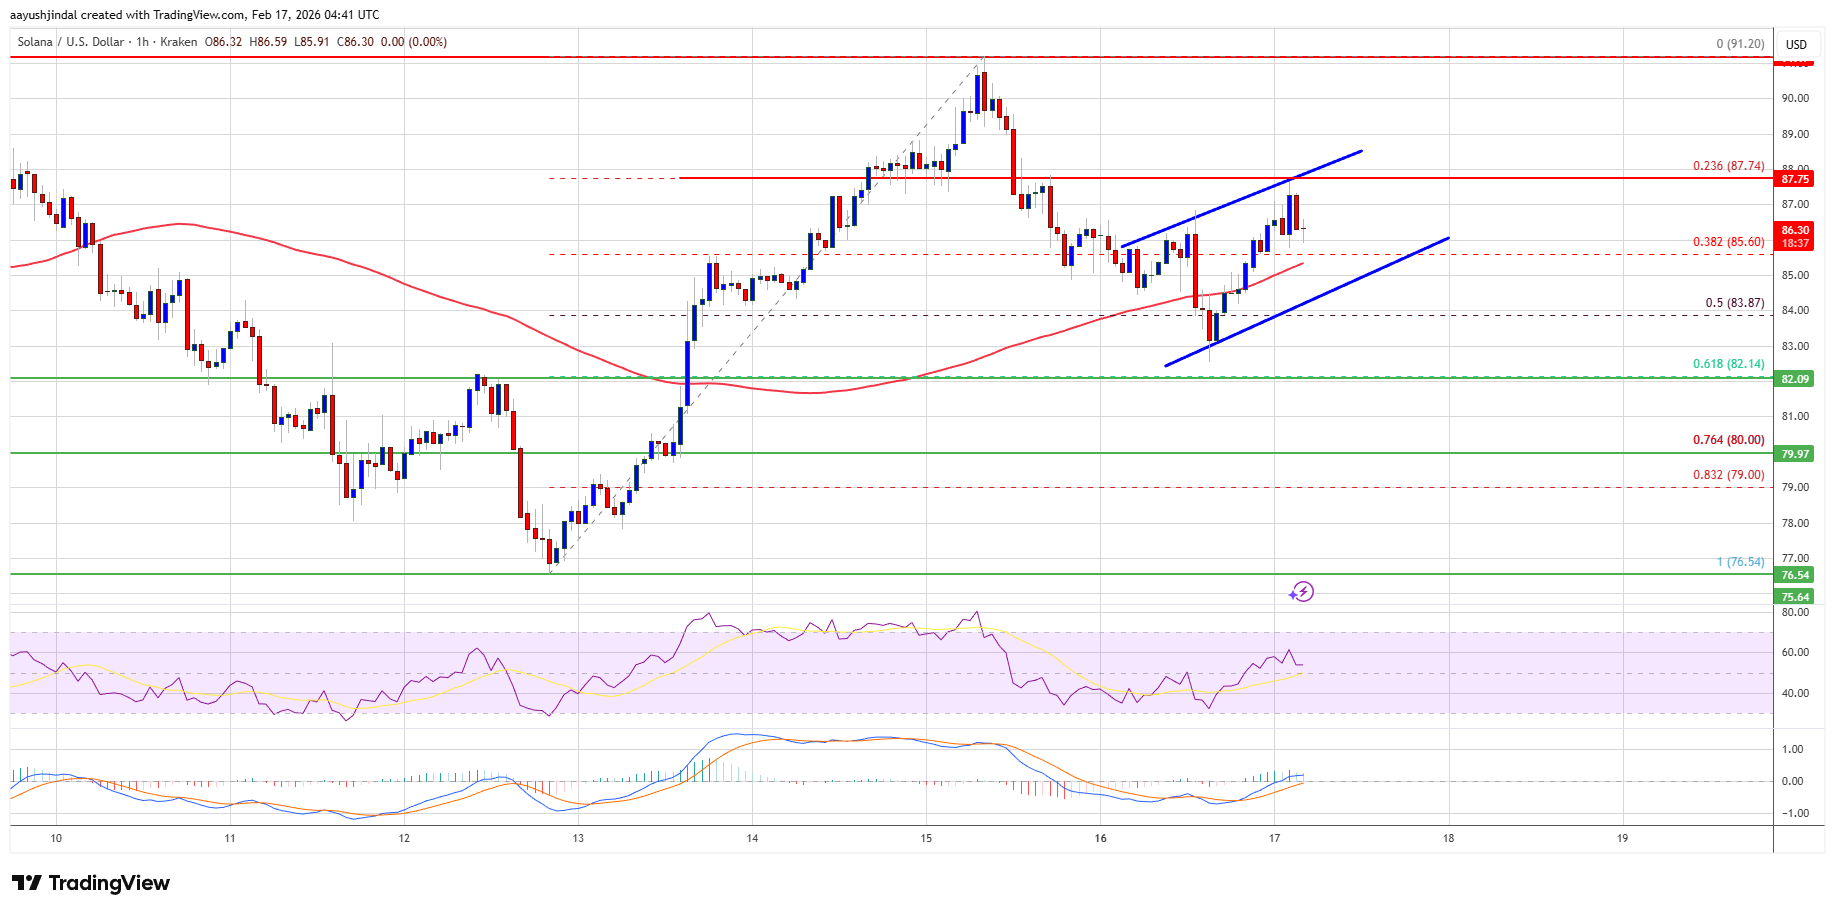
Solana failed to stay above $90 and corrected gains. SOL price is still above $85 and might attempt another increase in the near term. SOL price started a downside correction below $90 against the US Dollar. The price is...
Archive context
Older archive item. Useful for background and entity history, but not a fresh market-moving signal.

Solana failed to stay above $90 and corrected gains. SOL price is still above $85 and might attempt another increase in the near term.
- SOL price started a downside correction below $90 against the US Dollar.
- The price is now trading above $85 and the 100-hourly simple moving average.
- There is a rising channel forming with resistance at $88 on the hourly chart of the SOL/USD pair (data source from Kraken).
- The pair could extend losses if it dips below the $85 zone.
Solana price failed to surpass $92 and started a downside correction, like Bitcoin and Ethereum. SOL dipped below $90 and $88 to enter a short-term bearish zone.
There was a move below the 50% Fib retracement level of the upward wave from the $76.54 swing low to the $91.20 high. However, the bulls were active above the $82 support. The price is back above $85. There is also a rising channel forming with resistance at $88 on the hourly chart of the SOL/USD pair.
Solana is now trading above $85 and the 100-hourly simple moving average. On the upside, the price is facing resistance near the $88 level. The next major resistance is near the $90 level. The main resistance could be $92. A successful close above the $92 resistance zone could set the pace for another steady increase. The next key resistance is $95. Any more gains might send the price toward the $102 level.
Another Decline In SOL?If SOL fails to rise above the $92 resistance, it could start another decline. Initial support on the downside is near the $85 zone. The first major support is near the $82 level or the 61.8% Fib retracement level of the upward wave from the $76.54 swing low to the $91.20 high.
A break below the $82 level might send the price toward the $76.50 support zone. If there is a close below the $76.50 support, the price could decline toward the $72 support in the near term.
Technical Indicators
Hourly MACD – The MACD for SOL/USD is gaining pace in the bullish zone.
Hourly Hours RSI (Relative Strength Index) – The RSI for SOL/USD is above the 50 level.
Major Support Levels – $85 and $82.
Major Resistance Levels – $88 and $92.
Why this matters
Solana is a tracked market entity in the DigitalMoneyBox archive, making this useful context for readers monitoring repeated mentions and follow-up coverage.
Original source
Read on NewsBTCRelated market context

Ethereum Price Eyes $2,000 as AI Funds Shift From Chips to ETH, Says Tom Lee
Ethereum is pressing against a price level that has capped every rally. ETH trades at $1,925, little changed over the past 24 hour...

Worldcoin (WLD) Price Prediction: Can Grayscale’s Worldcoin ETF Filing Trigger a WLD Rebound Above $0.45?
The filing has put the token back in focus at a time when WLD remains well below its recent 2026 highs and technical indicators co...

Ethereum News: Builder Activity & Leverage Data Align, $2k Next?
In Ethereum news today, new smart contract deployments on the network have surged 192% above the 90-day baseline, with funding rat...

XRP Price Prediction: XRP Holds Above $1.14 as Bulls Battle to Reverse the Broader Downtrend
The move has improved the short-term technical picture, but the broader trend remains under pressure as XRP continues to trade bel...

Ethereum ETF Inflows Extend To Third Day As BlackRock Offsets Fidelity Outflows
US spot Ethereum ETFs have recorded a third consecutive day of net inflows, giving ETH traders another sign that institutional dem...

Trump Says Yes to Crypto Ethics Rule, Puts DOJ as Enforcer
Bitcoin is trading around $66,000 with muted directional conviction, while Washington has added another variable to the equation....