Solana (SOL) Range-Bound Below $90, Control Battle Intensifies
Solana started a fresh increase from the $83.50 zone. SOL price is now consolidating and might aim for more gains above the $85.50 zone. SOL price started a fresh upward move above the $83 and $84 levels against the US D...
Archive context
Older archive item. Useful for background and entity history, but not a fresh market-moving signal.

Solana started a fresh increase from the $83.50 zone. SOL price is now consolidating and might aim for more gains above the $85.50 zone.
- SOL price started a fresh upward move above the $83 and $84 levels against the US Dollar.
- The price is now trading above $84 and the 100-hourly simple moving average.
- There is a bullish trend line forming with support at $83.80 on the hourly chart of the SOL/USD pair (data source from Kraken).
- The pair could extend gains if it clears the $85.50 resistance zone.
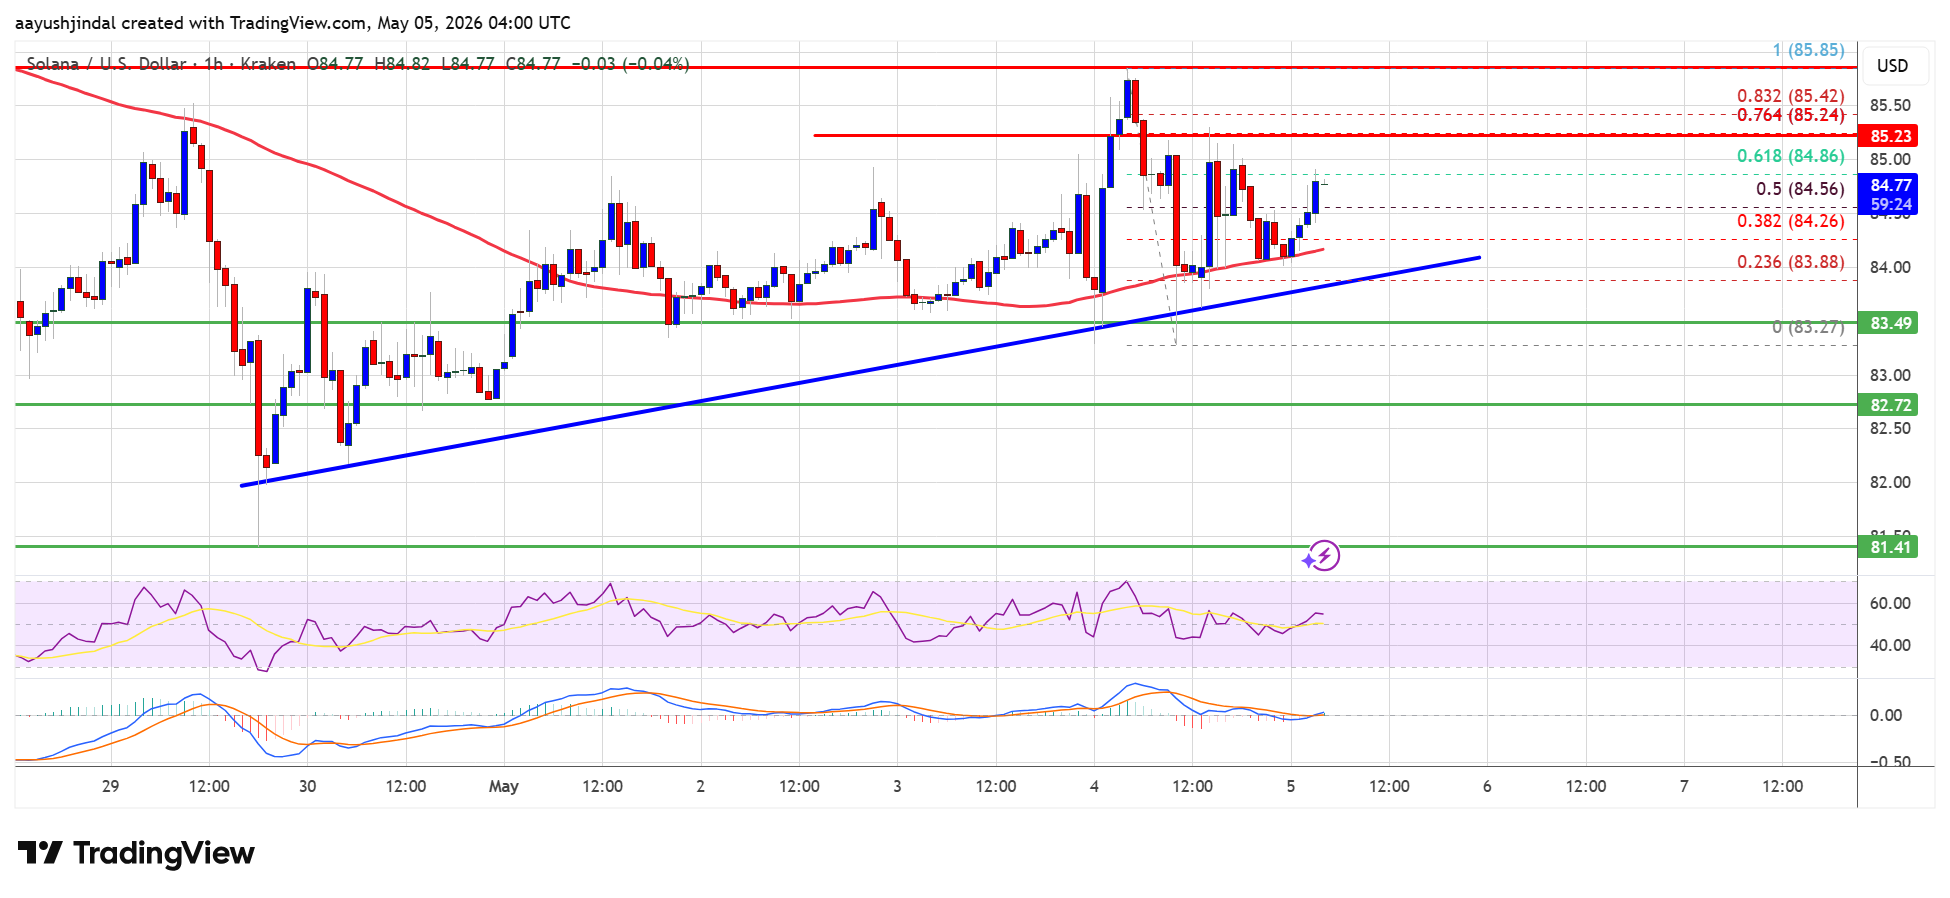
Solana price corrected gains from the $85.50 zone but remained stable above the $83 zone, like Bitcoin and Ethereum. SOL formed a low near $83.20 and started a fresh upward move.
The price climbed above the $84 level to enter a short-term positive zone. It surpassed the 50% Fib retracement level of the downward move from the $85.85 swing high to the $83.27 low. Besides, there is a bullish trend line forming with support at $84.00 on the hourly chart of the SOL/USD pair.
Solana is now trading above $84 and the 100-hourly simple moving average. On the upside, the price is facing resistance near $85.20 and the 76.4% Fib retracement level of the downward move from the $85.85 swing high to the $83.27 low. The next major resistance is near the $85.50 level.
The main resistance could be $88. A successful close above the $88 resistance zone could set the pace for another steady increase. The next key resistance is $90. Any more gains might send the price toward the $95 level.
Another Drop In SOL?If SOL fails to rise above the $85.50 resistance, it could start another decline. Initial support on the downside is near the $83.80 zone and the trend line. The first major support is near the $82.50 level.
A break below the $82.50 level might send the price toward the $80 support zone. If there is a close below the $78 support, the price could decline toward the $72 support in the near term.
Technical Indicators
Hourly MACD – The MACD for SOL/USD is gaining pace in the bullish zone.
Hourly Hours RSI (Relative Strength Index) – The RSI for SOL/USD is above the 50 level.
Major Support Levels – $83.80 and $82.50.
Major Resistance Levels – $85.50 and $88.00.
Why this matters
Solana is a tracked market entity in the DigitalMoneyBox archive, making this useful context for readers monitoring repeated mentions and follow-up coverage.
Original source
Read on NewsBTCRelated market context

Sam Altman ChatGPT AI Predicts a Historic XRP Price Move Before End of 2026
ChatGPT AI predicts a multi-year breakout for XRP, with the price prediction extending all the way to the end of 2027. From today’...

Ethereum (ETH) Price Prediction: $2,000 or $1,680 Next as ETH Reaches a Critical Turning Point
Ethereum price has fallen back below $1,900 after buyers failed to maintain the latest recovery, leaving ETH positioned between an...

Bitcoin (BTC) Price Today: Michael Saylor’s Strategy Reports $8.3B Loss as BTC Slides Below $64K
The BTC move comes shortly after Strategy reported an $8.33 billion operating loss for the second quarter of 2026, including an $8...
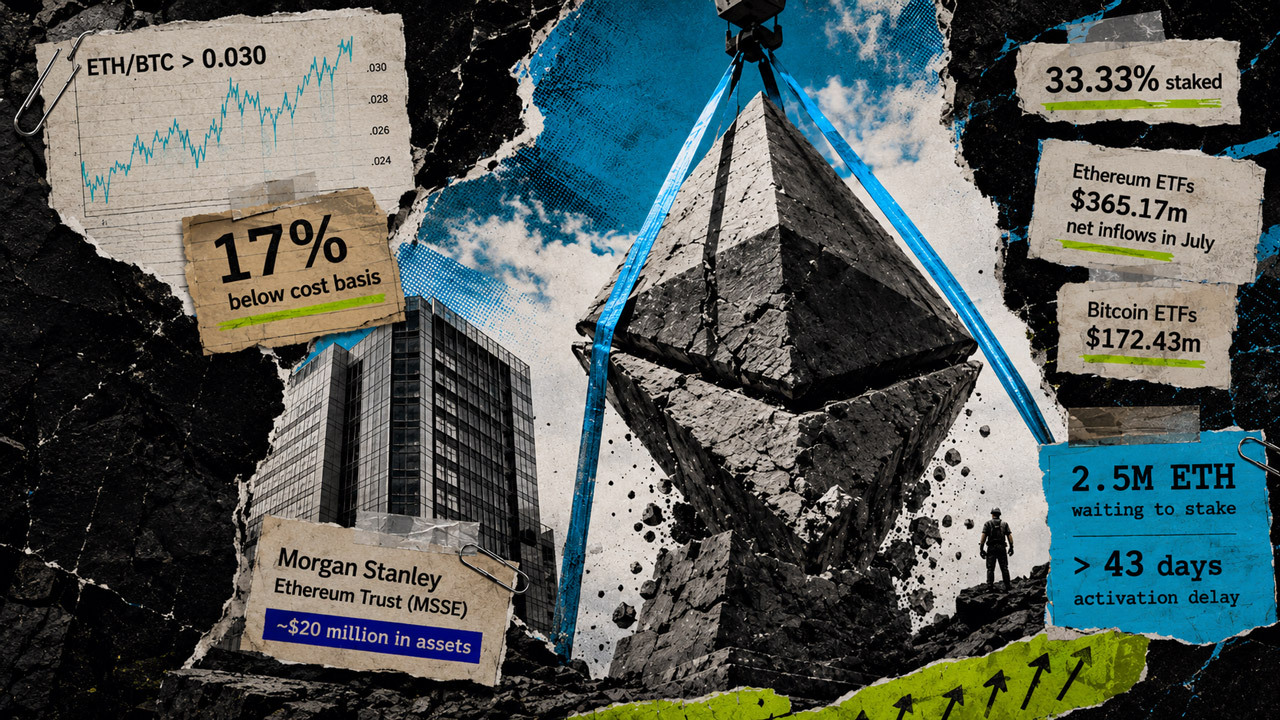
Ethereum just outpaced Bitcoin with $365 million in ETF inflows, but on-chain data shows the real bottom isn’t in yet
Ethereum outpaced Bitcoin in July as stronger investment-product demand and corporate accumulation powered its first sustained rel...

If Bitcoin breaks $62k over the weekend, a $1.1B short overhang stands ready to pull price down to $60k
Bitcoin enters the weekend near $62,900, less than 1% above the July 31 intraday low, and Deribit has already settled roughly $9.6...

Bitcoin Price Prediction: Michael Saylor’s Strategy Posts Massive Q2 Loss Despite Bigger Bitcoin Stack
Bitcoin is trading around $63,000 to $65,000 price range, as Strategy’s weak Q2 earnings add pressure to an already cautious marke...