Solana (SOL) Rebound Faces Major Test Near Key Resistance Zone
Solana found support at $83.50 and corrected some losses. SOL price is now consolidating below $88.50 and might struggle to continue higher. SOL price started a decent recovery wave above $85 and $86 against the US Dolla...
Archive context
Older archive item. Useful for background and entity history, but not a fresh market-moving signal.

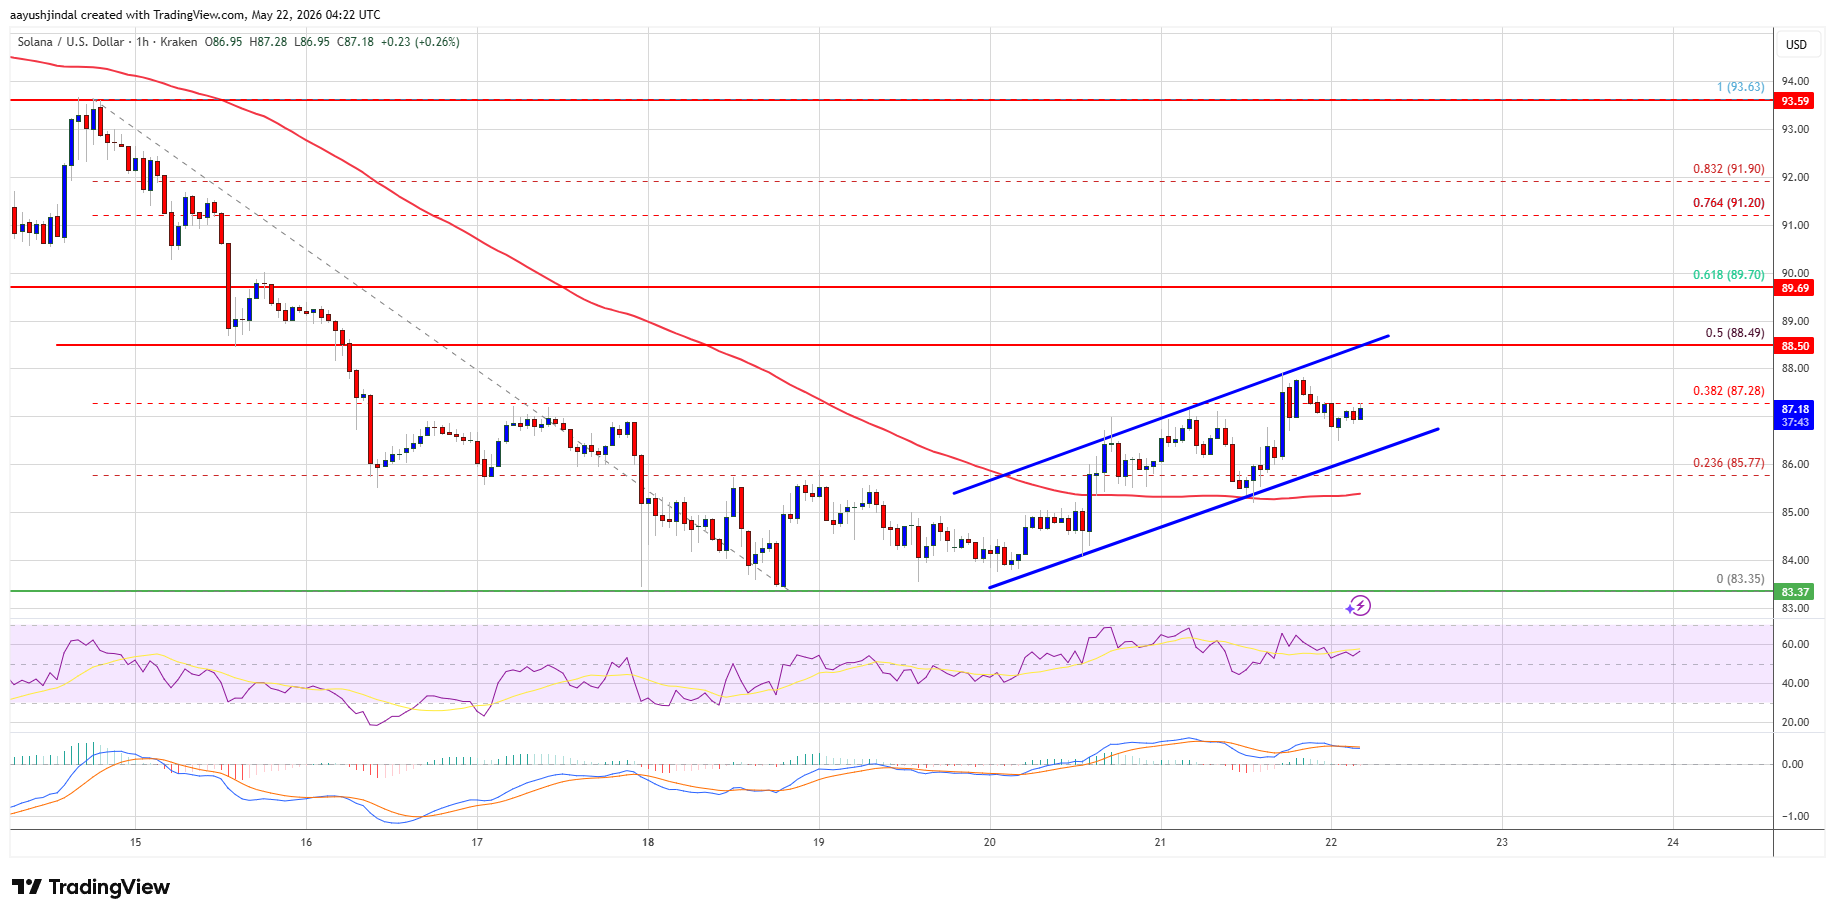
Solana found support at $83.50 and corrected some losses. SOL price is now consolidating below $88.50 and might struggle to continue higher.
- SOL price started a decent recovery wave above $85 and $86 against the US Dollar.
- The price is now trading above $86 and the 100-hourly simple moving average.
- There is a rising channel forming with resistance at $88.50 on the hourly chart of the SOL/USD pair (data source from Kraken).
- The price could continue to move up if it clears $88.50 and $90.00.
Solana price remained stable and started a decent recovery wave from $83.50, like Bitcoin and Ethereum. SOL was able to climb above the $85 level.
There was a move above the 38.2% Fib retracement level of the downward move from the $93.63 swing high to the $83.35 low. However, the bears remained active below $88. There is also a rising channel forming with resistance at $88.50 on the hourly chart of the SOL/USD pair.
Solana is now trading above $86 and the 100-hourly simple moving average. On the upside, immediate resistance is near the $88.00 level. The next major resistance is near the $88.50 level or the 50% Fib retracement level of the downward move from the $93.63 swing high to the $83.35 low.
The main resistance could be $90. A successful close above the $90 resistance zone could set the pace for another steady increase. The next key resistance is $92. Any more gains might send the price toward the $94 level.
Another Decline In SOL?If SOL fails to rise above the $88.50 resistance, it could continue to move down. Initial support on the downside is near the $86.20 zone. The first major support is near the $85.00 level.
A break below the $85.00 level might send the price toward the $83.50 support zone. If there is a close below the $83.50 support, the price could decline toward the $80 zone in the near term.
Technical Indicators
Hourly MACD – The MACD for SOL/USD is losing pace in the bearish zone.
Hourly Hours RSI (Relative Strength Index) – The RSI for SOL/USD is above the 50 level.
Major Support Levels – $86.200 and $85.00.
Major Resistance Levels – $88.50 and $90.00.
Why this matters
Solana is a tracked market entity in the DigitalMoneyBox archive, making this useful context for readers monitoring repeated mentions and follow-up coverage.
Original source
Read on NewsBTCRelated market context

Ethereum (ETH) Price Prediction: $2,000 or $1,680 Next as ETH Reaches a Critical Turning Point
Ethereum price has fallen back below $1,900 after buyers failed to maintain the latest recovery, leaving ETH positioned between an...

Bitcoin And Ethereum Edge Higher As Traders Watch Altcoin Rotation
Bitcoin and Ethereum edged higher into July 31, while a small shift in market dominance suggested traders were again watching whet...

Sam Altman ChatGPT AI Predicts a Historic XRP Price Move Before End of 2026
ChatGPT AI predicts a multi-year breakout for XRP, with the price prediction extending all the way to the end of 2027. From today’...

Bitcoin (BTC) Price Today: Michael Saylor’s Strategy Reports $8.3B Loss as BTC Slides Below $64K
The BTC move comes shortly after Strategy reported an $8.33 billion operating loss for the second quarter of 2026, including an $8...

Ethereum Turns 11 With $148B Stablecoin Base But Cooler Mainnet Fees
Ethereum has turned 11, and the network’s birthday arrives with a very Ethereum-style contradiction: it is still one of the most i...

If Bitcoin breaks $62k over the weekend, a $1.1B short overhang stands ready to pull price down to $60k
Bitcoin enters the weekend near $62,900, less than 1% above the July 31 intraday low, and Deribit has already settled roughly $9.6...