Solana (SOL) Tumbles to $80, Traders Watch Critical Support Defense
Solana failed to settle above $90 and extended losses. SOL price is now consolidating losses below $85 and might struggle to start a recovery wave. SOL price started a fresh decline below $85 and $82 against the US Dolla...

Solana failed to settle above $90 and extended losses. SOL price is now consolidating losses below $85 and might struggle to start a recovery wave.
- SOL price started a fresh decline below $85 and $82 against the US Dollar.
- The price is now trading below $85 and the 100-hourly simple moving average.
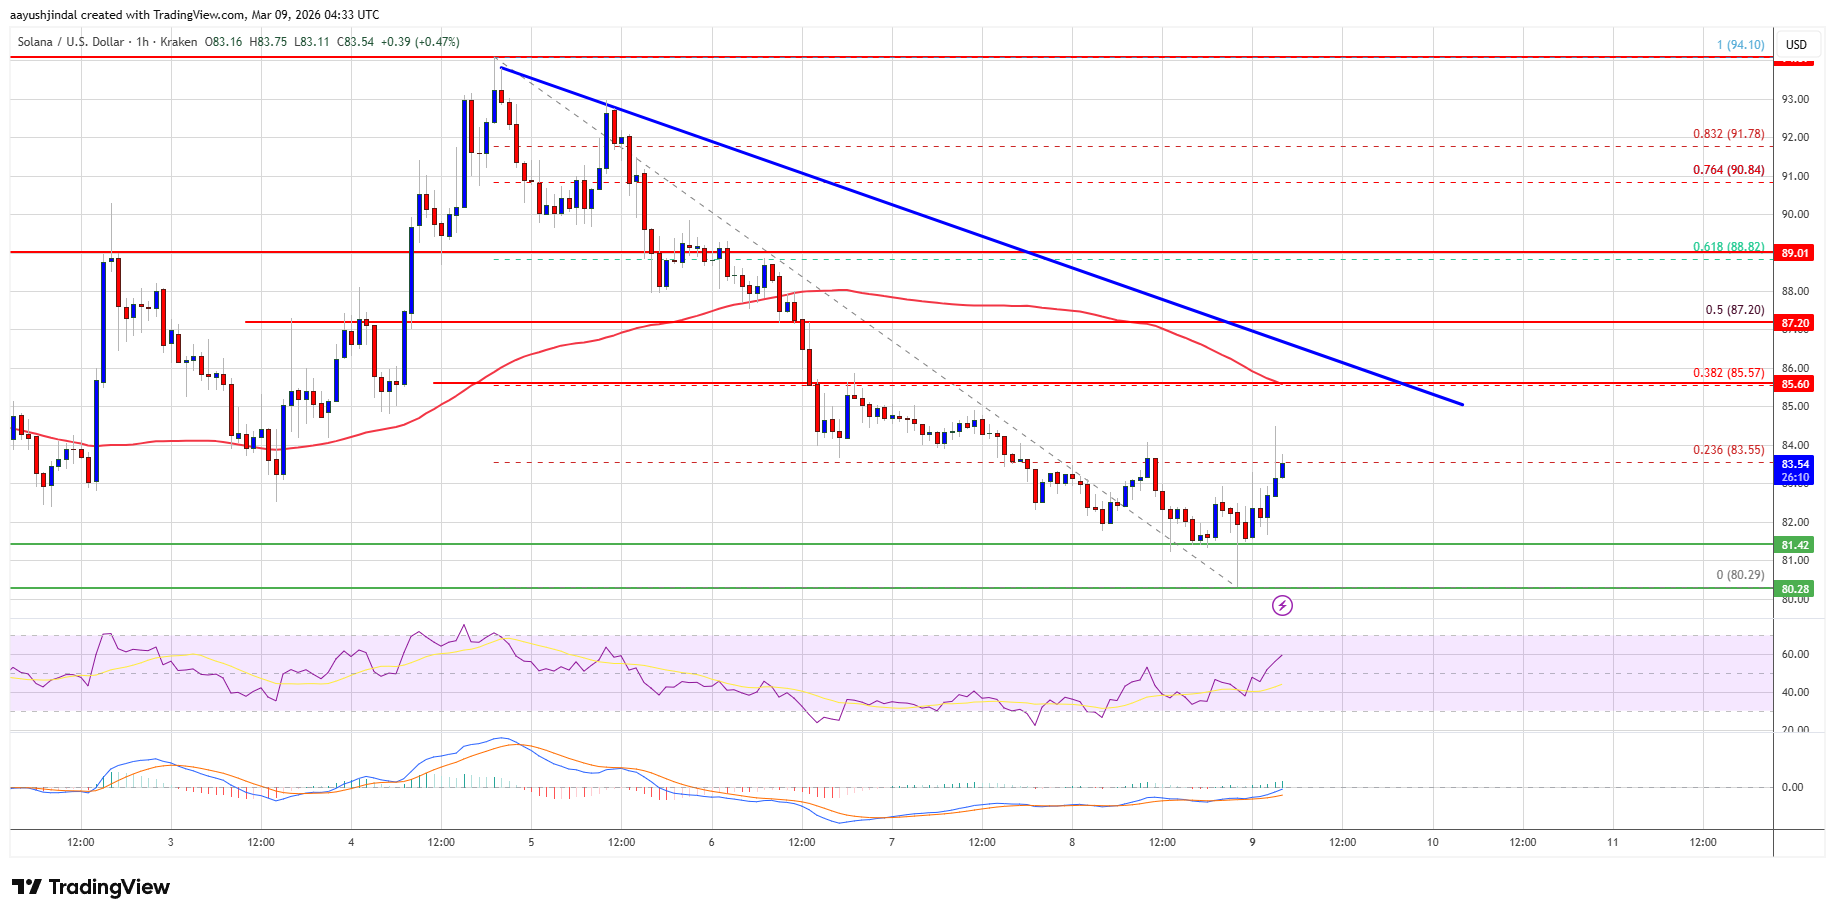
- There is a key bearish trend line forming with resistance at $85.50 on the hourly chart of the SOL/USD pair (data source from Kraken).
- The price could start a recovery wave if the bulls defend $82 or $80.
Solana price failed to remain stable above $90 and started a fresh decline, like Bitcoin and Ethereum. SOL declined below the $88 and $85 support levels.
The price gained bearish momentum below $83.50. A low was formed at $80.29, and the price is now consolidating losses below the 23.6% Fib retracement level of the downward move from the $94.10 swing high to the $80.29 low.
Solana is now trading below $85 and the 100-hourly simple moving average. On the upside, immediate resistance is near the $85 level. There is also a key bearish trend line forming with resistance at $85.50 on the hourly chart of the SOL/USD pair.
The next major resistance is near the $87.20 level or the 50% Fib retracement level of the downward move from the $94.10 swing high to the $80.29 low. The main resistance could be $88.80. A successful close above the $88.80 resistance zone could set the pace for another steady increase. The next key resistance is $95. Any more gains might send the price toward the $102 level.
More Losses In SOL?If SOL fails to rise above the $85 resistance, it could continue to move down. Initial support on the downside is near the $82 zone. The first major support is near the $80 level.
A break below the $80 level might send the price toward the $72 support zone. If there is a close below the $72 support, the price could decline toward the $65 support in the near term.
Technical Indicators
Hourly MACD – The MACD for SOL/USD is losing pace in the bearish zone.
Hourly Hours RSI (Relative Strength Index) – The RSI for SOL/USD is above the 50 level.
Major Support Levels – $82 and $80.
Major Resistance Levels – $85 and $88.
Original source
Read on NewsBTCRelated market context

Kraken Adds USDCx Support On Canton As Institutional Stablecoin Rails Expand
TL;DR Kraken says it now supports USDCx deposits and withdrawals on the Canton Network. USDCx is described as a Canton-native stab...

Ethereum Price Prediction: 3 Million ETH Rushes Into Staking as Sellers Vanish
Is nobody leaving Ethereum? A record 36 million ETH is now locked in staking, roughly 29–30% of the circulating supply, and the va...

XRP Price Prediction: Japan Regulates Crypto like Stocks, XRP to Benefit First
Japan just rewrote the rules. XRP price is battling below resistance at $1.10, but it’s prediction is getting bullish as Japan’s p...

XRP Price Prediction: Japan XRP ETF Listing is Getting Closer
Japan just handed XRP bulls a major regulatory tailwind. XRP price is retesting a congestion zone, and the prediction could turn b...

Kraken Becomes Official Crypto Exchange Supporter Of FIFA World Cup 2026
TL;DR Kraken says it has become the Official Crypto Exchange Supporter of the FIFA World Cup 2026. The tournament expands to 48 te...

Most Traders Will Scroll Past This Grok AI Bitcoin Predicts, Big Mistake
Elon Musk Grok AI just looked at a Bitcoin chart down more than 50% and predicts it’s a classic accumulation zone, targeting $150,...