Solana (SOL) Turns Lower From Key Zone—Is Support About to Be Tested?
Solana failed to stay above $142 and corrected gains. SOL price is now trading below $140 and might find bids near the $135 zone. SOL price started a downside correction below $142 against the US Dollar. The price is now...

Solana failed to stay above $142 and corrected gains. SOL price is now trading below $140 and might find bids near the $135 zone.
- SOL price started a downside correction below $142 against the US Dollar.
- The price is now trading above $135 and the 100-hourly simple moving average.
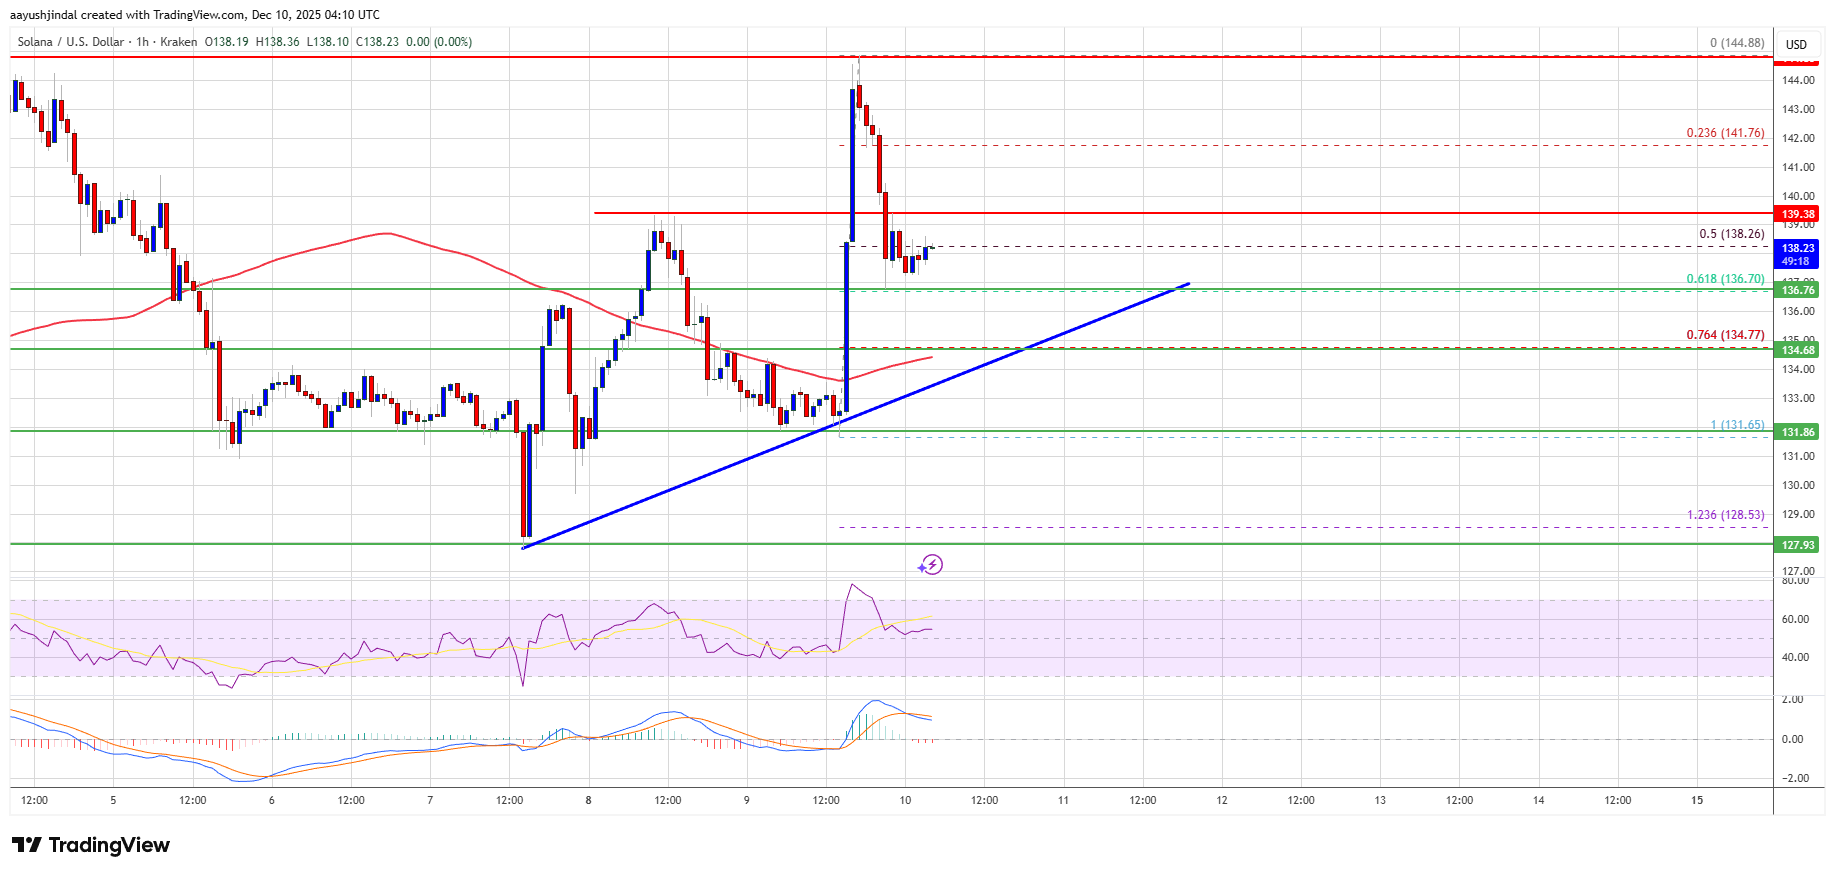
- There is a bullish trend line forming with support at $135 on the hourly chart of the SOL/USD pair (data source from Kraken).
- The pair could extend losses if it dips below the $135 zone.
Solana price failed to surpass $145 and started a downside correction, like Bitcoin and Ethereum. SOL dipped below $142 and $140 to enter a short-term bearish zone.
There was a move below the 50% Fib retracement level of the upward wave from the $131 swing low to the $145 high. However, the bulls are active near $136. There is also a bullish trend line forming with support at $135 on the hourly chart of the SOL/USD pair.
Solana is now trading above $135 and the 100-hourly simple moving average. On the upside, the price is facing resistance near the $140 level. The next major resistance is near the $145 level. The main resistance could be $148. A successful close above the $148 resistance zone could set the pace for another steady increase. The next key resistance is $155. Any more gains might send the price toward the $165 level.
More Losses In SOL?If SOL fails to rise above the $142 resistance, it could start another decline. Initial support on the downside is near the $136 zone and the 61.8% Fib retracement level of the upward wave from the $131 swing low to the $145 high. The first major support is near the $135 level and the trend line.
A break below the $135 level might send the price toward the $132 support zone. If there is a close below the $132 support, the price could decline toward the $125 support in the near term.
Technical Indicators
Hourly MACD – The MACD for SOL/USD is gaining pace in the bearish zone.
Hourly Hours RSI (Relative Strength Index) – The RSI for SOL/USD is below the 50 level.
Major Support Levels – $135 and $132.
Major Resistance Levels – $142 and $145.
Original source
Read on NewsBTCRelated market context

Ethereum Price Prediction: 3 Million ETH Rushes Into Staking as Sellers Vanish
Is nobody leaving Ethereum? A record 36 million ETH is now locked in staking, roughly 29–30% of the circulating supply, and the va...

XRP Price Prediction: Japan Regulates Crypto like Stocks, XRP to Benefit First
Japan just rewrote the rules. XRP price is battling below resistance at $1.10, but it’s prediction is getting bullish as Japan’s p...

Ethereum Nears 200 Million Non-Empty Wallets Despite Market Uncertainty
Despite persistent market uncertainty and bearish sentiment across parts of the cryptocurrency sector, Ethereum is approaching a s...

XRP Price Prediction: Japan XRP ETF Listing is Getting Closer
Japan just handed XRP bulls a major regulatory tailwind. XRP price is retesting a congestion zone, and the prediction could turn b...

Most Traders Will Scroll Past This Grok AI Bitcoin Predicts, Big Mistake
Elon Musk Grok AI just looked at a Bitcoin chart down more than 50% and predicts it’s a classic accumulation zone, targeting $150,...

The 3-Part Impulse That Shows Where The XRP Price Is Headed Next
XRP bulls are trying to turn a brutal selloff into something bigger than a relief bounce. An interesting setup shows a possible th...