Solana (SOL) Turns Positive Amid Market Calm — Does the Trend Have Legs?
Solana started a recovery wave above the $162 pivot zone. SOL price is now consolidating and faces hurdles near the $172 zone. SOL price started a decent upward move above $160 and $162 against the US Dollar. The price i...
Archive context
Older archive item. Useful for background and entity history, but not a fresh market-moving signal.

Solana started a recovery wave above the $162 pivot zone. SOL price is now consolidating and faces hurdles near the $172 zone.
- SOL price started a decent upward move above $160 and $162 against the US Dollar.
- The price is now trading above $162 and the 100-hourly simple moving average.
- There was a break above a contracting triangle with resistance at $162 on the hourly chart of the SOL/USD pair (data source from Kraken).
- The price could continue to move up if it clears $168 and $172.
Solana price extended losses below $150 before the bulls appeared, like Bitcoin and Ethereum. SOL tested the $145 zone and recently started a recovery wave.
There was a move above the $155 and $162 resistance levels. Besides, there was a break above a contracting triangle with resistance at $162 on the hourly chart of the SOL/USD pair. The pair even spiked above the 50% Fib retracement level of the downward move from the $188 swing high to the $145 low.
Solana is now trading above $162 and the 100-hourly simple moving average. On the upside, immediate resistance is near the $168 level. The next major resistance is near the $172 level or the 61.8% Fib retracement level of the downward move from the $188 swing high to the $145 low.
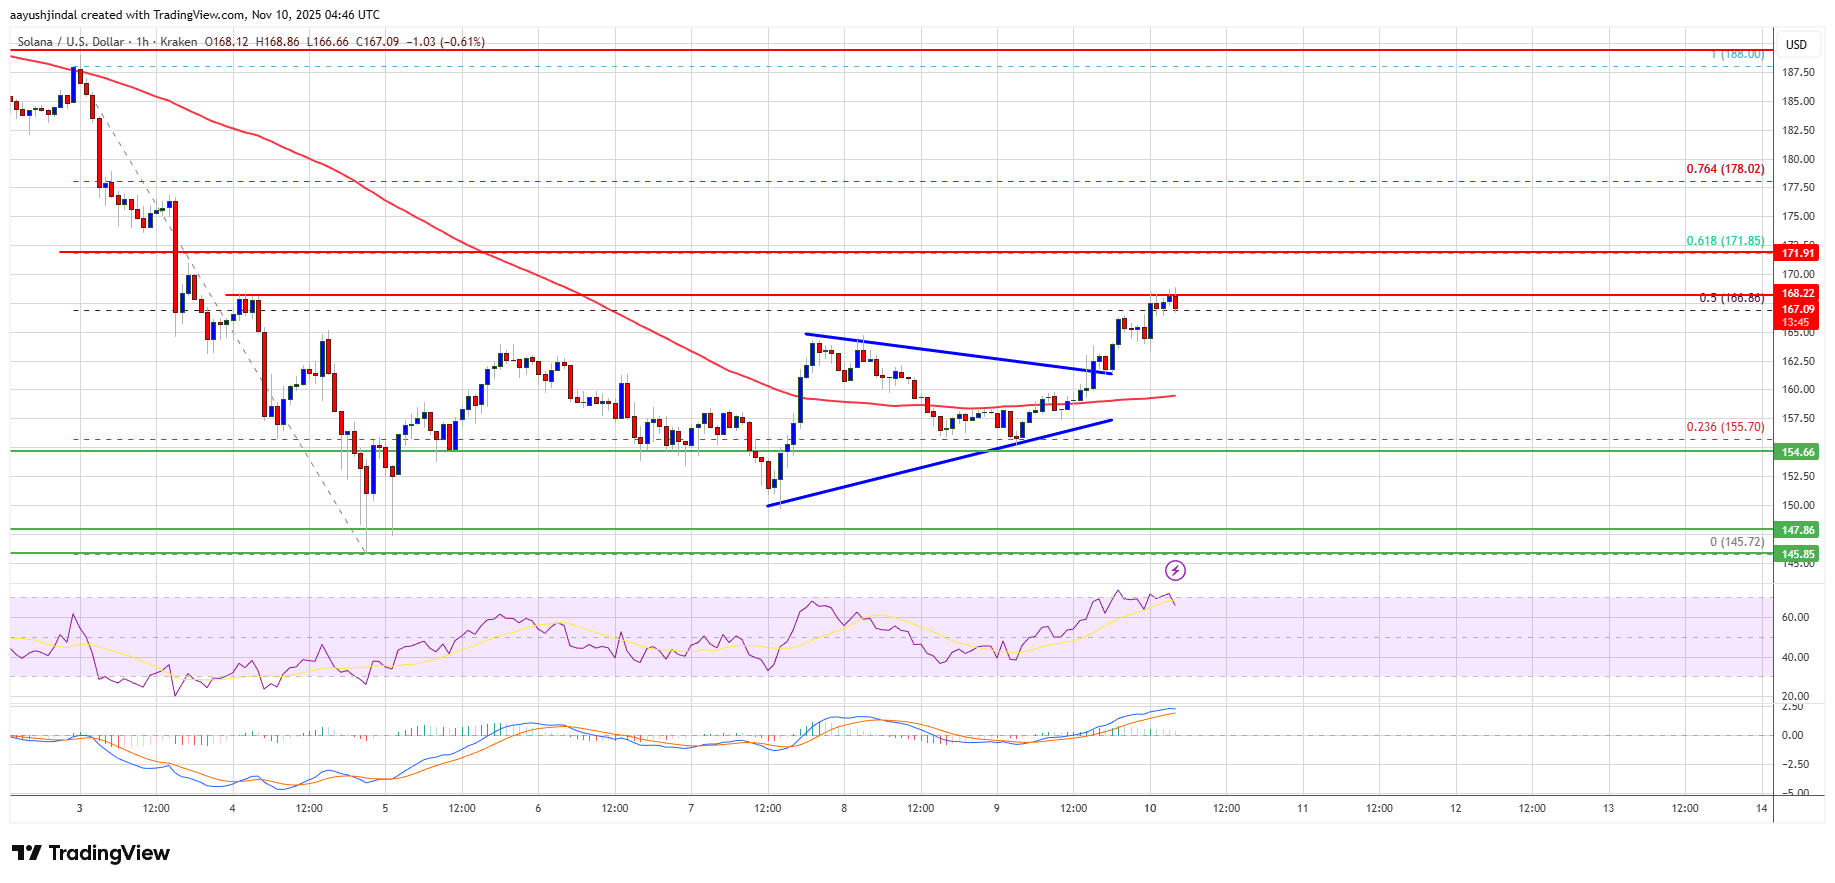
The main resistance could be $178. A successful close above the $178 resistance zone could set the pace for another steady increase. The next key resistance is $185. Any more gains might send the price toward the $196 level.
Another Decline In SOL?If SOL fails to rise above the $172 resistance, it could continue to move down. Initial support on the downside is near the $162 zone. The first major support is near the $160 level.
A break below the $160 level might send the price toward the $155 support zone. If there is a close below the $155 support, the price could decline toward the $150 zone in the near term.
Technical Indicators
Hourly MACD – The MACD for SOL/USD is gaining pace in the bullish zone.
Hourly Hours RSI (Relative Strength Index) – The RSI for SOL/USD is above the 50 level.
Major Support Levels – $155 and $150.
Major Resistance Levels – $168 and $172.
Why this matters
This altcoin story adds another data point to the current market tape and is useful when read alongside nearby source coverage.
Original source
Read on NewsBTCRelated market context

Ethereum (ETH) Price Prediction: Whale Rotates $155M Into ETH as Longs Surge Near $2,500
Ethereum is trying to stabilize after another volatile stretch, with price returning toward the mid-$2,400 region while several po...

Bitcoin (BTC) Price Prediction: $74K Liquidity Gap Puts $80K Support to the Test
Meanwhile, data from Glassnode and Fasanara Digital show that traditional financial assets are capturing a growing share of deriva...

Securitize Brings 12 U.S. Stocks to Solana With 1:1 Backing and U.S. Investor Access
Key Takeaways: Securitize has added 12 U.S. stock tokens to Solana, such as Apple, Nvidia, Tesla, Microsoft and Amazon. The backin...
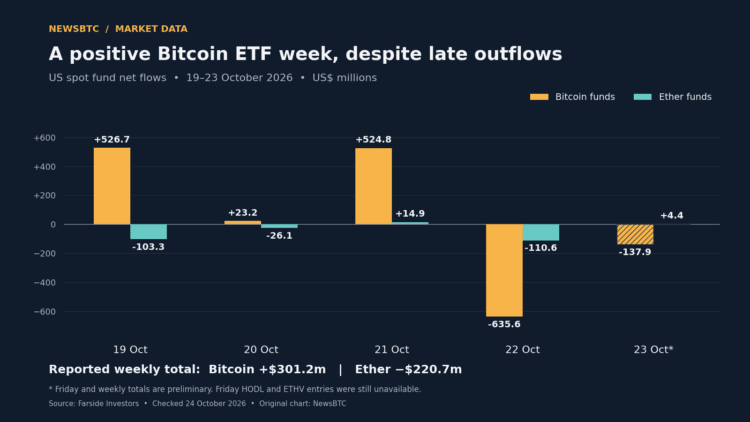
Bitcoin ETF Week Stays Positive After Nearly $774 Million In Late Outflows
TL;DR: Farside’s preliminary figures show US Bitcoin funds retaining a $301.2 million weekly inflow despite two days of withdrawal...
Bitcoin ETF Flows Trail Price Moves, DWF Study Finds
Bitcoin ETF flows track recent price moves more closely than subsequent ones, according to DWF Labs research published October 22....
Franklin Moves Bitcoin DRIP ETFs Toward Nasdaq With Dividend Reinvestment Plan
TL;DR: Franklin Templeton has filed exchange registrations for two stock-and-Bitcoin ETFs. Their strategy redirects equity dividen...