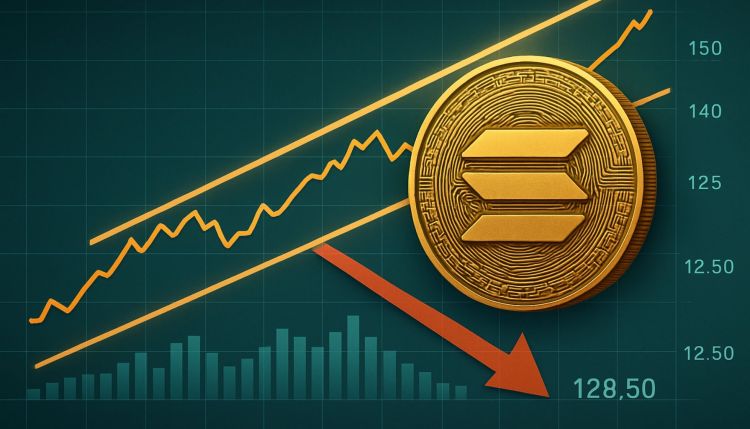
Solana Tests Rising Channel Support – Breakdown Could Send Price To $128.50 Level
Solana is facing a critical test this week, consolidating in a tight range between $145 and $160 since Monday. The price action reflects strong buying interest but also hesitation as bulls struggle to reclaim higher leve...
Archive context
Older archive item. Useful for background and entity history, but not a fresh market-moving signal.
Solana is facing a critical test this week, consolidating in a tight range between $145 and $160 since Monday. The price action reflects strong buying interest but also hesitation as bulls struggle to reclaim higher levels. Despite holding above key support, Solana must break decisively above resistance to confirm a bullish breakout and continue its upward trend.
Market momentum has favored bulls in recent weeks, but Solana’s inability to breach the $160 zone raises questions about the strength of this trend. Top analyst Carl Runefelt shared insights highlighting that Solana is currently ranging within a rising channel pattern—a structure that, while seemingly bullish, can often precede a breakdown to lower demand zones if support fails. This makes the coming days especially important for SOL’s trajectory.
As macro conditions improve and Bitcoin flirts with new all-time highs, Solana is expected to respond in kind. However, technical signals suggest caution. A break below the rising channel could target the $128.50 support area, while a successful breakout above $160 could open the door to retesting local highs. Traders and investors alike are closely watching Solana’s next move in this high-stakes consolidation phase.
Solana Holds Key Support Amid Rising Channel FormationSolana is currently trading below the $150 level, reflecting a notable 20% decline from its local high set in May. Despite this setback, the asset continues to hold a strong support base, signaling that bullish sentiment has not entirely faded. The broader market remains in a consolidation phase, with Solana showing signs of indecision as it moves sideways within a tightening price range.
Analysts remain cautiously optimistic, pointing out that a breakout above the key $150–$160 supply zone could spark renewed upside momentum. However, the current price structure suggests that Solana may not be ready yet to retest previous highs. According to Carl Runefelt, Solana is ranging within a rising channel—a pattern that can lead to sharp movements if broken.
While rising channels can sustain bullish continuation, a breakdown below the lower trendline often results in accelerated downside moves. Runefelt warns that if Solana breaks below the channel, the next key support area lies around $128.50. This level has historically acted as a strong demand zone and could serve as the next target in the event of a bearish move.
In the meantime, Solana’s consolidation reflects broader market uncertainty, with traders waiting for a decisive breakout or breakdown to guide positioning. A successful reclaim of the $150 level would improve sentiment significantly and could set the stage for a push toward the $170–$180 range. On the other hand, failure to hold above current levels may shift the narrative toward further downside risk.
SOL Holds Range Amid ResistanceSolana (SOL) is currently trading at $147.62, moving sideways within a tightening range and forming a potential rising channel pattern. The daily chart reveals that SOL has been unable to break decisively above the $155–$160 resistance zone, while strong support remains near the $140 level. Price action shows repeated rejections near the 100-day moving average (blue line), which now acts as dynamic resistance around $155.60. The 200-day moving average (red) sits further above $165.54, marking a long-term resistance area.
Volume remains relatively low compared to early June spikes, suggesting market participants are waiting for a clear breakout direction. A push above $160 would likely trigger bullish momentum, potentially opening the door toward the $170 level. However, the rising channel identified by analysts suggests a possible downside risk if the lower trendline fails.
If Solana breaks below the $145 support and falls out of the channel, the next target would be the $128.50 area, which previously acted as a demand zone in mid-May. Until then, bulls must defend current levels and aim to reclaim the 100-day SMA to maintain the broader recovery structure. The coming sessions may offer clarity as consolidation nears its resolution.
Featured image from Dall-E, chart from TradingView
Why this matters
This altcoin story adds another data point to the current market tape and is useful when read alongside nearby source coverage.
Original source
Read on NewsBTCRelated market context

Bitcoin (BTC) Price Prediction: BTC Holds $63K Support—Can Rising Active Addresses Offset Bearish Technical Signals?
Although the BTC price has remained near a key support zone, recent chart signals and Strategy’s sale of a portion of its Bitcoin...

Solana Price Prediction: SOL Holds Near $81 as Breakout Setup Points to $87, but Whale Flows Keep Risk Active
Solana price is back in focus after a sharp recovery pushed SOL towards the $81 area. The move has improved short-term momentum, e...

Hyperliquid (HYPE) Price Prediction: Symmetrical Triangle Breakout Puts $77 Target Back in Focus
The breakout comes after several sessions of price compression, with HYPE continuing to trade within a broader technical structure...

XRP Price Prediction: Volume and ETF Inflow Send Ripple Token Higher
XRP price pushed above the $1.14 resistance area after buyers stepped in with heavy volume and bullish prediction. The token climb...

Ethereum (ETH) Price Prediction: ETH Holds Near $1,780 as Bulls Eye $1,860–$1,950, but $1,609 Remains Key Invalidation
Ethereum price is trading near $1,779 after a mixed 24-hour session, according to Brave New Coin data. ETH is down around 0.76% on...

Solana adds 2M new addresses as bullish trend emerges
Solana's rapid user growth and transaction volume highlight its potential undervaluation, suggesting a future price correction is...