The Bulls Could Be Back For Solana If It Remains Above This Level
Solana price has displayed a completely bearish price thesis on the one-day chart. In that same timeframe, the coin declined by close to 9%. The depreciation in value might continue as the technical outlook points in the...
Archive context
Older archive item. Useful for background and entity history, but not a fresh market-moving signal.

Solana price has displayed a completely bearish price thesis on the one-day chart. In that same timeframe, the coin declined by close to 9%. The depreciation in value might continue as the technical outlook points in the same direction.
With the recent Solana Protocol Raydium hack of over $2 million, the price of the coin has been affected further. Over the past week, the coin has shed nearly 10% of its value. As SOL fell from its long-standing support line of $13, the coin has been on a freefall. Demand for the altcoin has remained substantially low, with investor interest fading away.
Investors have to be cautious as SOL continues to depict increased volatility over the past few weeks. For the bulls to return to the market, there are two important price levels that Solana has to breach. Trading volume in SOL declined, which is noted in the case of bearish price action.
As volatility remains high, a further push from the sellers will push SOL below its immediate support line. The market capitalization of SOL depreciated, an indication that the coin is under bearish influence.
Solana Price Analysis: One-Day ChartSOL was auctioning at $12.26 at the time of writing. The Solana price broke off its consolidation when it fell below the $13 support line. For the bulls to be back, Solana has to turn the $13 price level into a support line again. Before doing that, the coin has to move past the $12.50 price mark.
As the coin continues to register less demand, a further fall in value is on the chart. In that case, Solana will begin bidding at $11, then at $10.40. This will mean another 17% fall for the coin before it starts to note a price reversal. The amount of Solana traded in the last session declined, and that was a sign of bearishness on that chart.
Technical AnalysisOver the last few weeks, the altcoin was trying to capture buyers, but the price did not align with the bulls. The Relative Strength Index was below the 40-mark, close to the oversold and undervalued region.
Usually, after this phenomenon, the coin attempts to reverse its value. In relation to buyers, the Solana price was below the 20-Simple Moving Average line, depicting slow demand for the altcoin. It meant that the bears were driving the price momentum in the market.
According to the depiction of volatility, the technical indicators have sided with the idea of an explosive price action. The Bollinger Bands, which indicate price fluctuation and volatility, narrowed and were constricted, indicating that SOL was expecting a breakout.
The Moving Average Convergence Divergence depicts price momentum and change. The indicator painted a red signal bar, which was tied to the sell signal for Solana price.
Why this matters
This altcoin story adds another data point to the current market tape and is useful when read alongside nearby source coverage.
Original source
Read on NewsBTCRelated market context

American Bitcoin Corp. reports $126M Q3 profit as Bitcoin value surges
The report highlights Bitcoin's market volatility impact on corporate profits, influencing future market sentiment and investment...
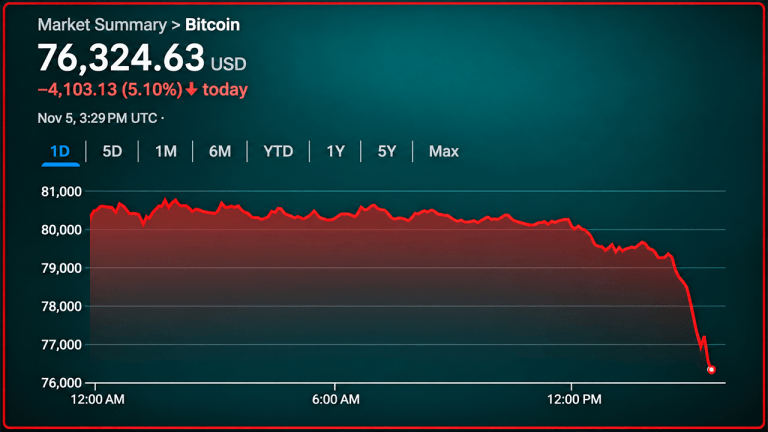
Bitcoin Price Tumbles Below $77,000 in Tech Stock Selloff
Bitcoin surrendered $5,046 from its Nov. 4 peak as a technology stock selloff rattled cryptocurrency markets Thursday, Nov. 5, 202...

Global markets slump as S&P 500, NASDAQ, Bitcoin see sharp declines
The market downturn signals increased risk aversion, potentially impacting investment strategies and economic stability globally....

Kalshi, Coinbase stock perps under threat ahead of CFTC deadline
Tomorrow will be a climactic moment in a competitive battle between the Chicago Board Options Exchange (CBOE), Kalshi, and Coinbas...

Bitcoin Slides Below $77,000 as Ether Sinks 7%
Total crypto market value fell 6.8% over 24 hours, while bitcoin gave back much of Wednesday’s post-election rebound.... Read the...

Bitcoin tumbles below $77K as tech and crypto stocks plunge in broad market selloff
The rapid liquidation highlights the risks of high leverage in volatile markets, potentially triggering cascading sell-offs and ma...