Trader uncovers signs XRP price may have bottomed — Rally to $3.80 next?
XRP (XRP) price fell 22% between March 19 and March 31, potentially forming a local bottom at $2.02. The price then increased by 9% to $2.20 before retracing to current levels. Has the popular altcoin finally bottomed ou...
Archive context
Older archive item. Useful for background and entity history, but not a fresh market-moving signal.

XRP (XRP) price fell 22% between March 19 and March 31, potentially forming a local bottom at $2.02. The price then increased by 9% to $2.20 before retracing to current levels.
Has the popular altcoin finally bottomed out, or is there a deeper retracement in the cards?
XRP bullish divergence on multiple timeframesThe XRP relative strength index (RSI) displays bullish divergence conditions in lower timeframes, according to analyst CasiTrades.
A bullish divergence is when the asset’s price prints lower lows and the RSI produces higher lows, indicating that downward momentum is waning.
“After reaching the 0.786 retrace at $2.05, XRP is printing bullish divergences from the 15-min all the way up to the 4-hour chart,” the analyst said in a March 31 post on X.
CasiTrades notes that these signals are a positive indicator both for short-term bounces and potential macro recovery.
“That’s the kind of signal we want to see for both short-term bottom and macro! The bounce is holding so far!”XRP/USD hourly chart. Source: CasiTrades
She added that $2.25 remains a key resistance level to watch, as breaching it with strong momentum would signal a convincing bullish breakout.
“If we break above $2.25 with strong momentum, that would invalidate the need for another support retest, a very bullish sign,” CasiTrades said, adding that the demand zone between “$2.00 and $2.01 remains a support if the $2.05 doesn’t hold.”
The analyst projects a bullish month for XRP in April, with targets of $2.70 and $3.80 in the short term.
“Once the price reaches its target, I expect a large impulse to the upside! Key resistance aligning to $2.70 and $3.80.”Related: XRP funding rate flips negative — Will smart traders flip long or short?
Is the XRP local bottom in?Despite XRP’s recent recovery from local lows, the risk of a deeper correction remains, according to veteran trader Peter Brandt.
Last week, Brandt said the presence of a “textbook” head-and-shoulders pattern (H&S) could see XRP price as low as $1.07.
This potential H&S pattern is still in play on the daily chart (see below) and will be completed on a break and close below the neckline at $1.90.
If the price stays below the neckline, the pair could plummet to $1.50 and then to the pattern’s target of $1.07.
Brandt said:
“Below $1.9, I would not want to own it. H&S projects to $1.07. Don't shoot the messenger.”XRP/USD daily chart with H&S pattern. Source: Cointelegraph/TradingView
Brandt said this bearish chart pattern would be invalidated if buyers push and maintain the price above $3.00.
Meanwhile, macroeconomic headwinds from US tariffs on April 2 may spook traders, pulling the XRP price toward $1.31.
Not everyone agrees. Analyst Dark Defender shared a positive outlook, saying that XRP price is likely to revisit the last Fibonacci level at $2.04 before bouncing back again.
According to the analyst, a key resistance level for XRP is $2.22, which “should be broken” to ensure a sustained recovery toward the Wave 5 target at $8.
“April-May will be hot, and our targets of Wave 5 stand at $5-8 levels, as expected.”XRP/USD daily chart. Source: Dark Defender
This article does not contain investment advice or recommendations. Every investment and trading move involves risk, and readers should conduct their own research when making a decision.
Why this matters
This altcoin story adds another data point to the current market tape and is useful when read alongside nearby source coverage.
Original source
Read on CointelegraphRelated market context

Bitcoin (BTC) Price Prediction: Hidden Weekly RSI Divergence Warns of Pullback as BTC Tests $80K
Bitcoin price was trading around $80,500 on Bitstamp in the latest technical reading, up 3.11% on the session. While the price rem...
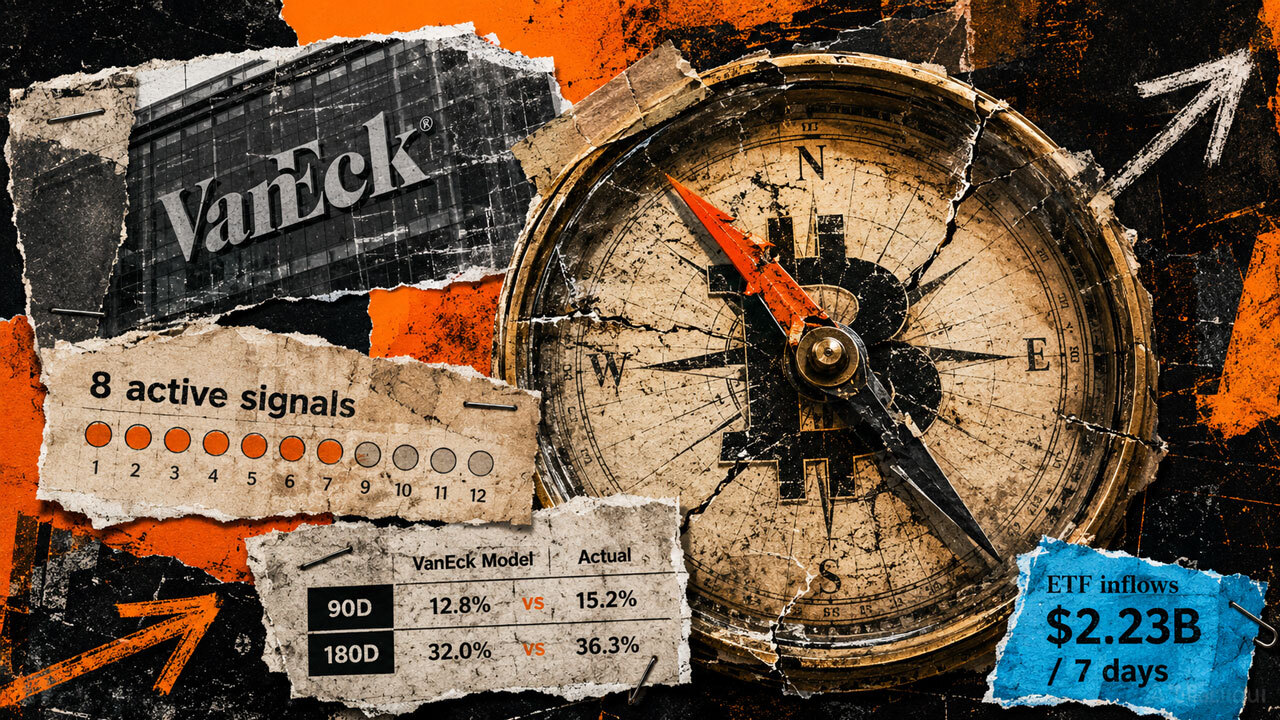
Bitcoin’s bottom signal is flashing, but six months of data shows a trap waiting for early buyers
Bitcoin’s late-August recovery has unfolded in stages. Days prior to the Aug. 19 pump, VanEck’s capitulation dashboard showed broa...

Morgan Stanley leads Solana ETF $9 million inflows as SOL jumps rises above $100
US Solana exchange-traded funds (ETFs) attracted about $9.1 million in net inflows on Aug. 26, led by Morgan Stanley’s MSOL. SoSoV...
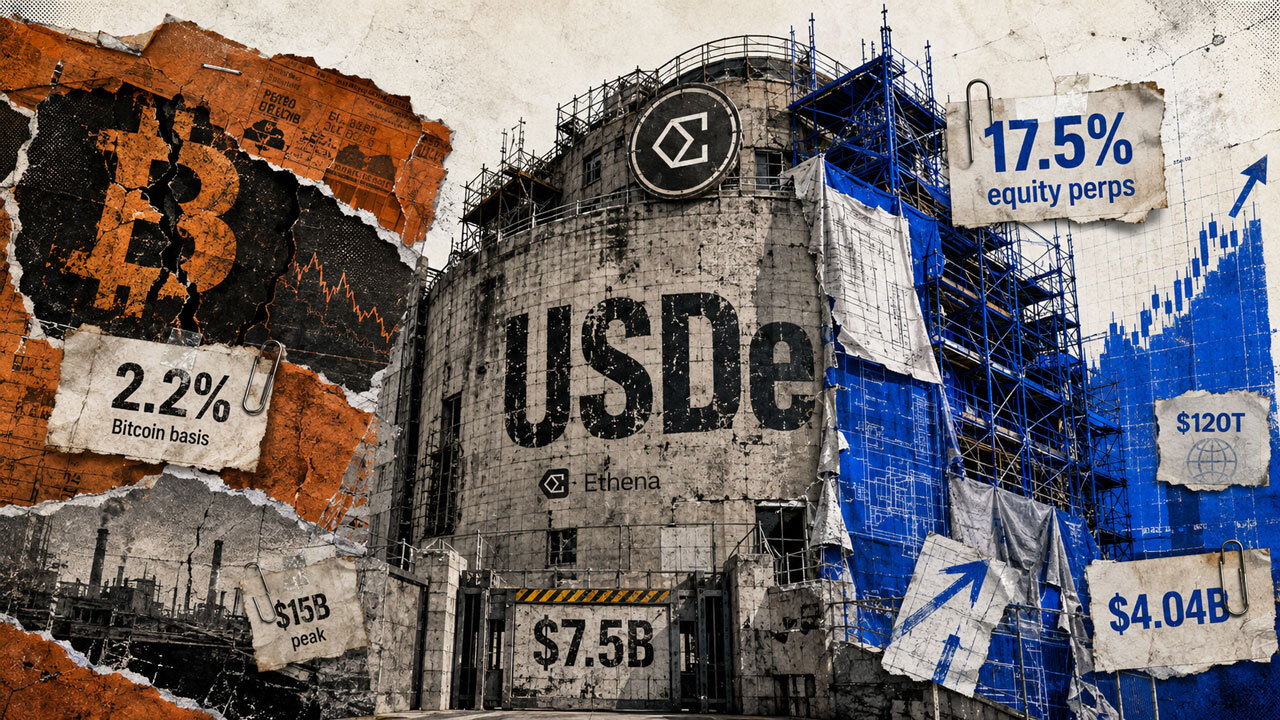
Ethena is targeting the $120 trillion Wall Street stock market to hunt yields 5x higher than Bitcoin
Ethena is expanding USDe into equity perpetual-basis trades, targeting funding yields more than five times higher than Bitcoin’s a...

Bitcoin falls below $79,000 as profit-taking stalls a 20% rally
Bitcoin's dip highlights market volatility and the impact of macroeconomic factors, emphasizing the need for cautious trading stra...

Bitcoin Price Prediction: Can BTC Get Back Over $80,000?
Today’s Bitcoin price prediction has BTC trading at $79,500, up around +1.1% over the past 24 hours, as the coin’s late-August gri...