Why This Pundit Believes It’s “Game Over” For XRP Following The Crash
The recent market-wide crash that sent the XRP price tumbling to $1.2 before an immediate rebound has left traders wondering whether the worst is over. Crypto analyst Steph, in a detailed technical analysis shared on X,...
Archive context
Older archive item. Useful for background and entity history, but not a fresh market-moving signal.

The recent market-wide crash that sent the XRP price tumbling to $1.2 before an immediate rebound has left traders wondering whether the worst is over. Crypto analyst Steph, in a detailed technical analysis shared on X, noted that the latest move could be an important turning point for XRP. Although his outlook acknowledges the possibility of recovery, his deeper analysis of XRP’s chart history and key indicators paints a mixed picture of what lies ahead for the cryptocurrency.
Bearish RSI Divergence Echoes 2021 Price CollapseAccording to Steph, XRP’s current structure on the weekly timeframe closely mirrors the 2020 to 2021 cycle that led to a 74% correction. The analyst highlighted a bearish RSI divergence where the price forms higher highs while the RSI forms lower highs, indicating that buying momentum is fading even as prices attempt to climb.
In his view, this pattern has always indicated exhaustion in bullish strength and the beginning of corrections. Steph drew comparisons to late 2024, up until July 2025, when XRP’s weekly RSI was declining despite rising prices. This setup has now triggered the most recent 65% correction that reached a bottom over the weekend.
He noted that the correction, which started around July 14, has lasted more than 80 days, similar to the duration of the 2021 correction. Based on this, XRP could be nearing the end of its corrective phase before a rebound if history repeats itself.
Steph acknowledged that the crypto market’s recent crash was heavily influenced by macroeconomic factors, including the US president’s announcement of a 130% tariff on Chinese imports, effective November 1. This shock, combined with leveraged positions across the market, led to the deepest liquidation wicks ever recorded for XRP.
Nonetheless, the analyst believes that XRP has flushed out excessive leverage and cleared liquidity zones around $2.25, and this has set the stage for a possible rebound to higher liquidity targets and new all-time highs above $4. However, sustained bullish momentum from here depends on reclaiming other important price levels.
XRP Price Levels To Watch Before Calling A BottomDespite the bullish prediction, it is important to note that XRP is still at a technical crossroads that can either be bullish or bearish. The price has fallen below its range between $2.65 and $2.84, which had served as support for months. Therefore, reclaiming at least $2.65 on the weekly close is essential to confirm that the bottom is in and that the recovery phase has begun.
In his video, crypto analyst Steph also talked about the importance of the 50-week simple moving average (SMA), which is currently around $2.45. Closing below this line has marked the start of bear markets for XRP. If we see one or two weekly closes below $2.40, then that’s a signal to exit crypto.
The bullish prediction, one that could even lead XRP to new all-time highs, depends on if it manages a weekly close above $2.4, breaks above $2.65 and its 50-week SMA, and sustains buying strength. At the time of writing, XRP is trading at $2.52, up by 2.6% in the past 24 hours.
Why this matters
This altcoin story adds another data point to the current market tape and is useful when read alongside nearby source coverage.
Original source
Read on NewsBTCRelated market context
Bitcoin Hashrate Reclaims One Zettahash As Mining Competition Rebounds
TL;DR: BlocksBridge reported Bitcoin’s seven-day hashrate above one zettahash in the week to October 22. Mining competition has re...

Ethereum (ETH) Price Prediction: Whale Rotates $155M Into ETH as Longs Surge Near $2,500
Ethereum is trying to stabilize after another volatile stretch, with price returning toward the mid-$2,400 region while several po...

PHP Flaw Shakes Internet, Bitcoin Flashes Bull Signal, and More – Weekly Recap
This week’s stories covered shifting market signals, DeFi expansion, institutional staking, venture capital and cybersecurity. Uni...
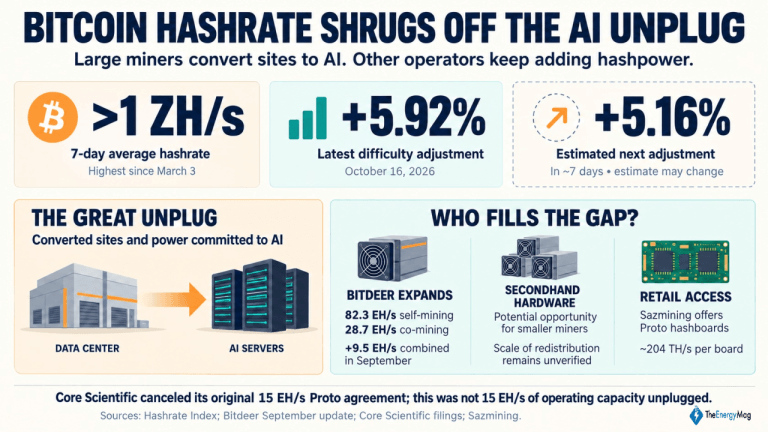
Miner Weekly: Bitcoin Hashrate Shrugs off the AI Unplug, Regaining 1 ZH/s Level
Big public miners are making room for artificial intelligence (AI). Bitcoin’s hashrate is climbing anyway. This article first appe...
Bitcoin’s Fed Week Starts With A Fresh Rise In US Inflation Expectations
TL;DR: US household inflation expectations rose in October while consumer sentiment barely changed. The readings add context ahead...

Arthur Hayes exits crypto trading positions as analysts track $26 million in sales
Arthur Hayes has exited Maelstrom's directional crypto positions, and on-chain analysts are tracking about $26 million in token sa...