Will XRP Price Hold 100 SMA and Trigger a Fresh Increase?
XRP price extended its increase above the $0.5450 resistance. The price is now correcting gains and might remain strong above the 100-hourly SMA. XRP extended its increase above the $0.5450 resistance zone. The price is...

XRP price extended its increase above the $0.5450 resistance. The price is now correcting gains and might remain strong above the 100-hourly SMA.
- XRP extended its increase above the $0.5450 resistance zone.
- The price is now trading above $0.5250 and the 100-hourly Simple Moving Average.
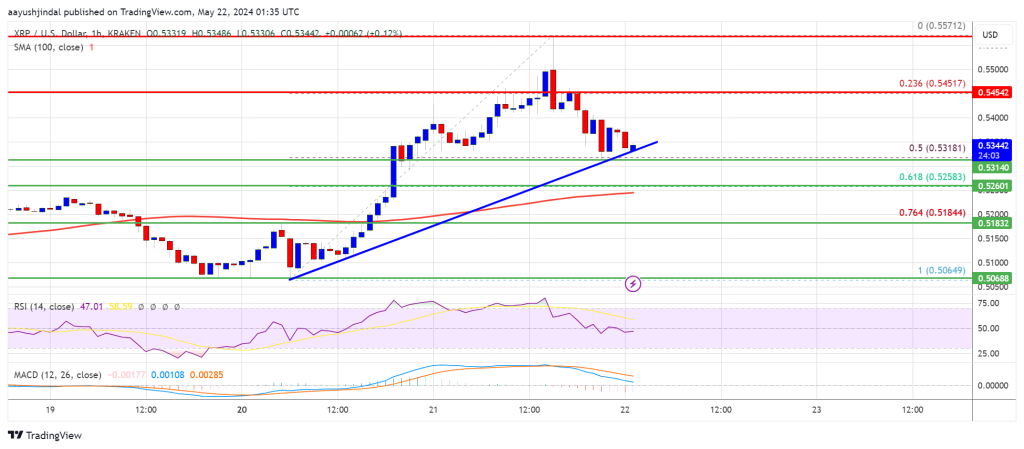
- There is a key bullish trend line forming with support at $0.5330 on the hourly chart of the XRP/USD pair (data source from Kraken).
- The pair is correcting gains, but there could be a fresh increase unless there is a close below the 100-hourly SMA.
After a close above the $0.520 level, XRP price remained in a positive zone, like Bitcoin and Ethereum. It cleared the $0.5320 and $0.5450 resistance levels. There was also a spike above the $0.550 level.
A new weekly high was formed at $0.5571, and the price is now correcting gains. There was a move below the $0.5450 level. The price dipped below the 23.6% Fib retracement level of the upward wave from the $0.5065 swing low to the $0.5571 high.
It is now trading above $0.530 and the 100-hourly Simple Moving Average. There is also a key bullish trend line forming with support at $0.5330 on the hourly chart of the XRP/USD pair.
Immediate resistance is near the $0.5380 level. The first key resistance is near $0.5450. A close above the $0.5450 resistance zone could send the price higher. The next key resistance is near $0.5570. If the bulls push the price above the $0.5570 resistance level, there could be a steady increase toward the $0.5650 resistance. Any more gains might send the price toward the $0.5720 resistance.
More Losses?If XRP fails to clear the $0.5450 resistance zone, it could continue to move down. Initial support on the downside is near the $0.5330 level and the trend line. It is close to the 50% Fib retracement level of the upward wave from the $0.5065 swing low to the $0.5571 high.
The next major support is at $0.5250. The main support is now near $0.5185. If there is a downside break and a close below the $0.5185 level, the price might accelerate lower. In the stated case, the price could drop and test the $0.5065 support in the near term.
Technical Indicators
Hourly MACD – The MACD for XRP/USD is now losing pace in the bullish zone.
Hourly RSI (Relative Strength Index) – The RSI for XRP/USD is now below the 50 level.
Major Support Levels – $0.5330 and $0.5185.
Major Resistance Levels – $0.5450 and $0.5570.
Original source
Read on NewsBTCRelated market context

Bitcoin Stabilizes Near Key Zone, But Glassnode Warns Capital Flows Remain Weak
Bitcoin’s rebound from the $60,000 area has given bulls something to work with, but Glassnode’s latest market read suggests the re...

BTC News Today: Bitcoin Climbs Toward $66K as Trump Reveals US-Iran Peace Deal
The renewed geopolitical optimism helped improve risk sentiment across financial markets, pushing Bitcoin back toward the $66,000...

XRP Price Prediction: US-Iran Peace Deal Fuels 13% XRP Surge, Analysts Target $1.94 Retest
The latest move saw XRP price today reclaim the $1.28 level for the first time in nearly two weeks. Market participants pointed to...

Emerging-market stocks near record high as tech gains boost rally, leaving crypto behind
The tech-driven rally in emerging markets highlights a shift in capital allocation, potentially sidelining crypto as investors cha...

XRP Price Analysis: Ripple Token Eyes 10% Gain with Flashing Bullish Pattern and ETF Inflows
XRP price posts 9% moves today from low $1.1 to $1.24, with a prediction that it could go even higher. Two independent tailwinds a...
Bitcoin yield is already here, now finance wants to make it normal
Bitcoin's protocol rewards miners through block subsidies and transaction fees, leaving holders who sit on coins with no claim on...