XLM Price (Stellar) Surges Along XRP, Can Bulls Push It To $0.12?
Stellar (XLM) started a strong increase above the $0.0950 resistance against the US Dollar. XLM price is gaining pace and might aim for $0.120. There was a steady increase in Stellar’s token price above $0.0950 against t...

Stellar (XLM) started a strong increase above the $0.0950 resistance against the US Dollar. XLM price is gaining pace and might aim for $0.120.
- There was a steady increase in Stellar’s token price above $0.0950 against the US dollar.
- It is now trading above $0.100 and the 100 hourly simple moving average.
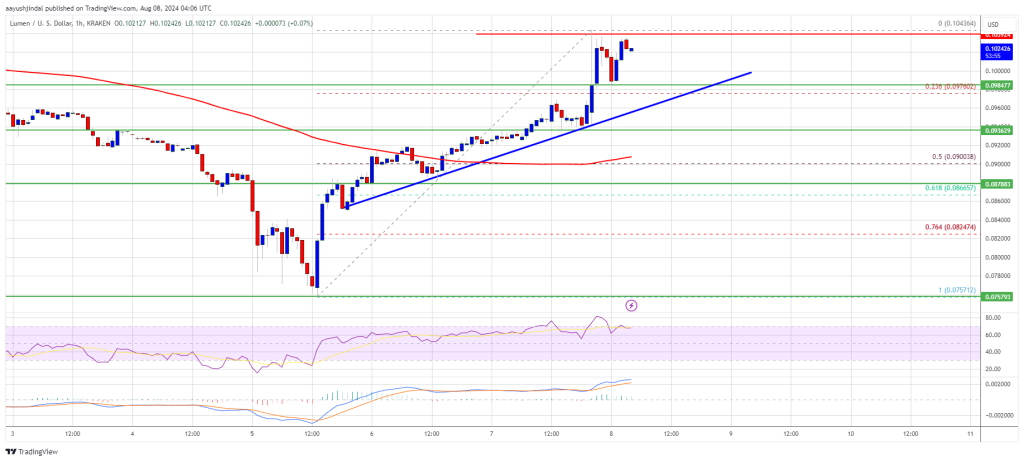
- There is a major bullish trend line forming with support near $0.0980 on the hourly chart of the XLM/USD pair (data source from Kraken).
- The pair is likely to continue higher towards $0.1150 and $0.1200 in the near term.
After forming a strong support base above $0.0750, Stellar (XLM) saw a strong increase above $0.0850 against the US Dollar, following XRP surge. It gained over 10% beating Bitcoin in the short term.
There was a clear move above the $0.0950 and $0.100 resistance levels. The price tested the $0.1050 zone. A high was formed at $0.1043 and the price is now consolidating gains. There was a minor decline below the $0.10 level. The price tested the 23.6% Fib retracement level of the recent increase from the $0.0757 low to the $0.1043 high.
XLM price is now trading above the $0.10 resistance and the 100 hourly simple moving average. There is also a major bullish trend line forming with support near $0.0980 on the hourly chart of the XLM/USD pair.
On the upside, an immediate resistance is near the $0.1050 level. The next major resistance is near the $0.1120 level, above which the price could test $0.1150. A close above the $0.1150 level might start a steady increase toward the $0.1200 and $0.1250 levels. The next major stop could be $0.1300 or even $0.1320.
Are Dips Supported in XLM?If XLM price struggles to continue higher, it could start a downside correction. Immediate support on the downside is near the $0.0980 level or the trend line.
The next major support is near the $0.090 level or the 100 hourly SMA. A clear break below the $0.0900 support zone could spark a fresh decline. The next major support on the downside is near the $0.0800 level.
Technical Indicators
Hourly MACD – The MACD for XLM/USD is gaining pace in the bullish zone.
Hourly RSI (Relative Strength Index) – The RSI for XLM/USD is currently well above the 50 level.
Major Support Levels – $0.0980 and $0.0900.
Major Resistance Levels – $0.1050 and $0.1200.
Original source
Read on NewsBTCRelated market context

Google Gemini AI Predicts Jaw-Dropping XRP Price For Next 90 Days
Google Gemini AI just put XRP back under the spotlight, predicting it is tightly wound for a major breakout toward $1.60 to $1.80...

Elon Musk SpaceX AI Predicts Incredible Bitcoin Price For Next 30 Days
Here is the thing about capitulation calls. They only sound smart in hindsight. Right now, with Bitcoin price scraping along the l...

Standard Chartered Says Bitcoin Bottomed Near $59,000 As Crypto Winter Ends
TL;DR Standard Chartered’s Geoffrey Kendrick reportedly says Bitcoin’s $59,000 area marked the cycle bottom. The note cites SpaceX...

Tether USDT Briefly Overtakes Ethereum in Market Cap: A $187B Wake-Up Call
For a few hours, earlier this week, Tether USDT stablecoin held a higher market cap than Ethereum, the first time that has happene...

Bitcoin rises above $64,000 after Pakistan prime minister says Iran peace deal is near
Bitcoin traded above $64,000 on Saturday, supported by its strongest ETF inflows in a month and growing optimism around geopolitic...

Bitcoin price faces new risk as big buyers lose conviction
Bitcoin’s largest buyers are no longer behaving like a reliable backstop for the largest cryptocurrency. The exchange-traded funds...