XRP 2017 Breakout Replay? Analyst Drops Bold Target As Multi-Year Pattern Repeats
A crypto market analyst has suggested that XRP appears to be forming “one of its most significant multi-year structural patterns to date,” which could lead the altcoin to a rally similar to its 2017 expansion. XRP Eyes 2...
Archive context
Older archive item. Useful for background and entity history, but not a fresh market-moving signal.

A crypto market analyst has suggested that XRP appears to be forming “one of its most significant multi-year structural patterns to date,” which could lead the altcoin to a rally similar to its 2017 expansion.
XRP Eyes 2017-Like ExpansionOn Thursday, market observer ChartNerd stated that XRP appears to be repeating a setup that may surpass the scale of the 2017 pre-breakout formation, which led to a massive 68,000% expansion during that cycle.
In a video, the analyst explained that the altcoin has been developing since 2020, when the price saw its bear market bottom and created an ascending support level that held for nearly six years.
Since then, XRP has resembled its pre-2017 performance, where the cryptocurrency experiences significant advances after retesting its ascending support, followed by sharp corrections within descending channels.
As the chart shows, the altcoin recorded a 10x move between 2020 and 2021, which was followed by the 2022 bear market. After bottoming, XRP saw another 2x rally before retesting the trendline for the first time. The price then rallied another 6-7x between late 2024 and mid-2025, leading to the July all-time high (ATH) of $3,65.
Now, the cryptocurrency is developing a similar corrective pattern to the previous two retests of the ascending support, which could suggest the potential for 1,992% rally to a double-digit target upon confirmation.
“If XRP respects this pattern into late 2026, this is where we could potentially create the third retest, which is what we saw in the early cycles before the expansion in 2017,” the analyst asserted.
He also added that “if we are repeating this sort of multi-year cycle from before, just on a larger scale here, then this could be one of the largest structural phases where XRP is building a base and waiting for the leg up.”
Consolidation Until Late May?ChardNerd also shared a short-term outlook for XRP based on its performance over the past 11 weeks. He noted that on the daily timeframe, the altcoin is still hovering between major descending resistance and ascending support levels, forming a triangle pattern.
So, you can see, since we actually formed the base back here in February, we worked down to $1.11, created the resistance, which came back to create this ascending level of support roughly at $1.28. Then we’ve seen this break up to sort of $1.50, and we’ve now pulled back to the support line once again.
Taking this into consideration, alongside the fact that its RSI levels are oversold on the daily timeframe, the analyst believes that XRP could be building a base near the ascending support before attempting to retest the descending resistance.
Nonetheless, he observed that “because we’re converging in this range and it’s been about 8 to 9, maybe 10 weeks of range-bound price action, it would be likely that we still see this compression” squeeze into the pattern’s apex until at least mid-May, when the price is expected to see a directional breakout from the formation.
Ultimately, the market observer suggested that “as long as we respect the trend line and continue to defend ascending support (…), it’s looking for a retest back towards sort of $1.50 in the short term.”
Why this matters
XRP is showing up inside the Layer 2 theme, so this story is worth tracking for follow-through rather than treating it as a one-off headline.
Original source
Read on NewsBTCRelated market context

Bitcoin (BTC) Price Today: 2028 Halving Cycle and BlackRock ETF Inflow Signal Long-Term Rally
Recent market data also show that Bitcoin buyers have absorbed a key sell wall around $85,000, reducing one source of near-term re...
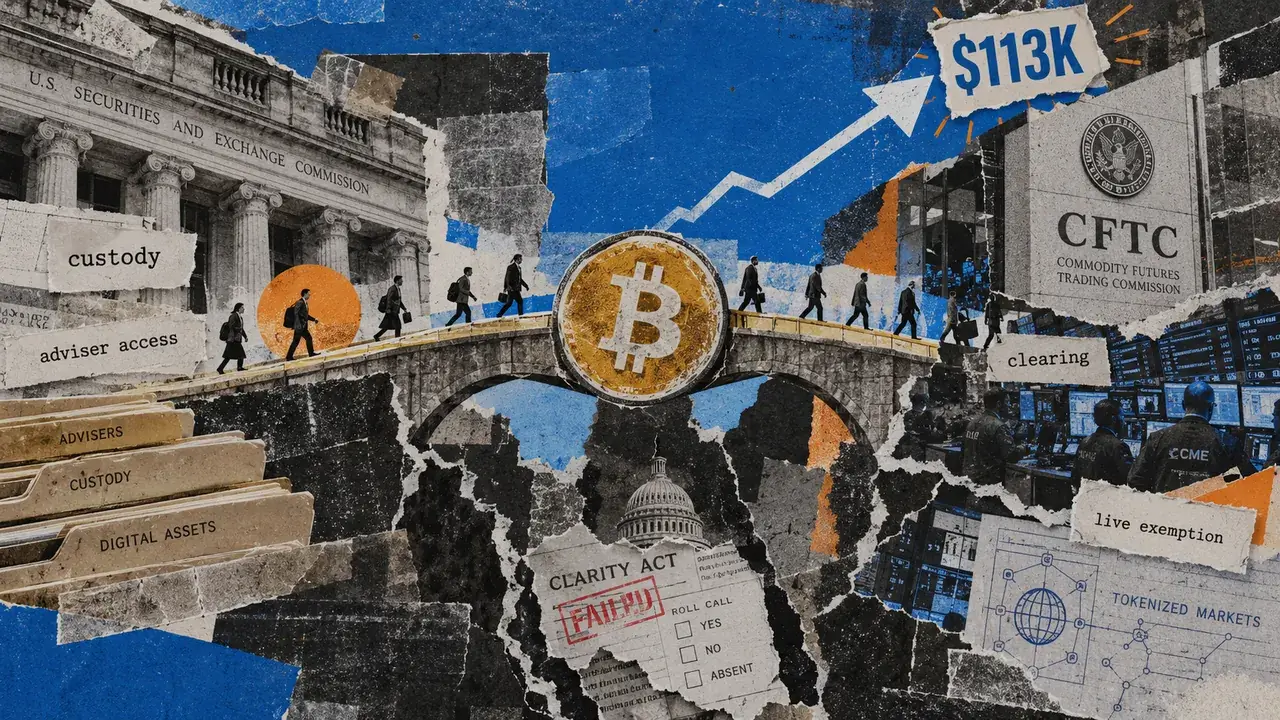
Bitcoin’s $113,000 case strengthens as US regulators push 9 crypto actions
The US Securities and Exchange Commission (SEC) proposed a custody framework on Oct. 1 that would let investment advisers and regu...

Bitcoin Posts Best Quarter Since 2024 as ETF Inflows Reach $6.34 Billion
Bitcoin ended the third quarter with its strongest quarterly performance since the final three months of 2024, as renewed demand f...

Ethereum Layer 2 Blast Is Shutting Down, Saying Costs Now Exceed What the Chain Earns
Blast, the Ethereum layer 2 network created by Blur founder Tieshun “Pacman” Roquerre, is shutting down, its team announced on X o...

Bitcoin sees big overnight rally as ETF demand returns before the next US jobs test
Bitcoin retook $86,000 by the morning of Oct. 2 as demand for US spot Bitcoin ETFs recovered, with short covering a plausible acce...

IMF Praises El Salvador — But Still Tries To Scale Back Its Bitcoin Project
Bitcoin Magazine IMF Praises El Salvador — But Still Tries To Scale Back Its Bitcoin Project The International Monetary Fund has p...