XRP Bears Keeps Pushing, Indicators Suggest A Strengthening Case of More Losses
XRP price started a fresh decline from the $0.5050 resistance zone. The price could decline further if there is a close below the $0.4865 support. XRP extended losses and traded below the $0.500 support. The price is now...

XRP price started a fresh decline from the $0.5050 resistance zone. The price could decline further if there is a close below the $0.4865 support.
- XRP extended losses and traded below the $0.500 support.
- The price is now trading below $0.4950 and the 100-hourly Simple Moving Average.
- There is a key bearish trend line forming with resistance at $0.4980 on the hourly chart of the XRP/USD pair (data source from Kraken).
- The pair could slide further toward the $0.4550 support in the near term.
Recently, XRP price attempted a recovery wave above the $0.5050 level. However, the bears were active and the price started a fresh decline below the $0.500 support, like Ethereum and Bitcoin.
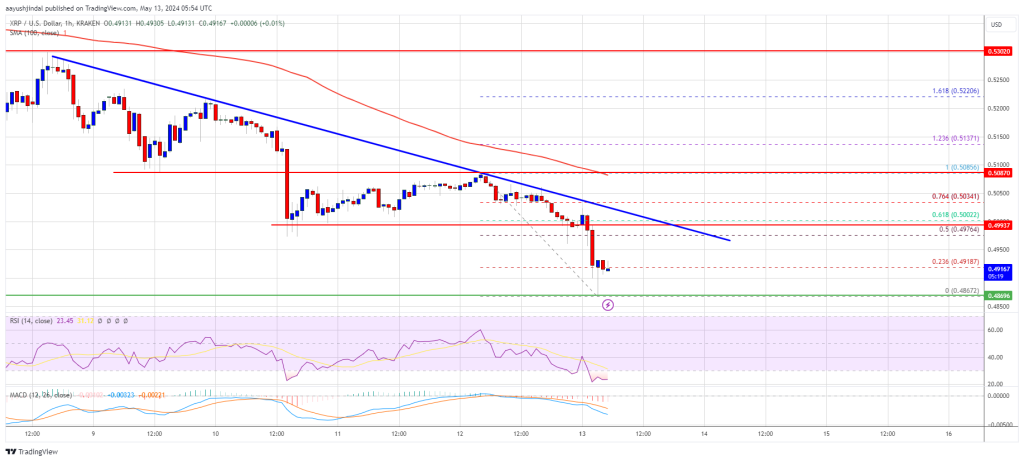
There was a move below the $0.4920 and $0.4880 levels. A low was formed at $0.4867 and the price is now consolidating losses. It is trading near the 23.6% Fib retracement level of the downward move from the $0.5085 swing high to the $0.4867 low.
The price is now trading below $0.4950 and the 100-hourly Simple Moving Average. Immediate resistance is near the $0.4980 level. There is also a key bearish trend line forming with resistance at $0.4980 on the hourly chart of the XRP/USD pair. It is close to the 50% Fib retracement level of the downward move from the $0.5085 swing high to the $0.4867 low.
Source: XRPUSD on TradingView.com
The first key resistance is near $0.500. A close above the $0.500 resistance zone could spark a strong increase. The next key resistance is near $0.5085 and the 100-hourly Simple Moving Average. If the bulls remain in action above the $0.5085 resistance level, there could be a rally toward the $0.5250 resistance. Any more gains might send the price toward the $0.550 resistance.
More Losses?If XRP fails to clear the $0.50 resistance zone, it could start another decline. Initial support on the downside is near the $0.4865 level.
The next major support is at $0.4780. If there is a downside break and a close below the $0.4780 level, the price might accelerate lower. In the stated case, the price could retest the $0.450 support zone.
Technical Indicators
Hourly MACD – The MACD for XRP/USD is now gaining pace in the bearish zone.
Hourly RSI (Relative Strength Index) – The RSI for XRP/USD is now below the 50 level.
Major Support Levels – $0.4865 and $0.4780.
Major Resistance Levels – $0.500 and $0.5085.
Original source
Read on NewsBTCRelated market context

Bitcoin Stabilizes Near Key Zone, But Glassnode Warns Capital Flows Remain Weak
Bitcoin’s rebound from the $60,000 area has given bulls something to work with, but Glassnode’s latest market read suggests the re...

BTC News Today: Bitcoin Climbs Toward $66K as Trump Reveals US-Iran Peace Deal
The renewed geopolitical optimism helped improve risk sentiment across financial markets, pushing Bitcoin back toward the $66,000...
Crypto News, June 16: US-Iran Deal Oddity, FTX Claim Day, ETH USD Season Drawing Closer
We start today’s crypto news with a few oddities in the US-Iran deal as it closed faster than most expected, while the bombing tal...

XRP Price Prediction: US-Iran Peace Deal Fuels 13% XRP Surge, Analysts Target $1.94 Retest
The latest move saw XRP price today reclaim the $1.28 level for the first time in nearly two weeks. Market participants pointed to...

Lummis Links Bitcoin to $39.2T US Debt Crisis as CLARITY Act Nears Senate Floor
Senator Cynthia Lummis publicly tied Bitcoin to America’s $39.2 trillion national debt crisis on June 15, positioning the asset as...

Ethereum Research Proposal Targets Post-Quantum Wallet Security At Low Gas Cost
A new Ethereum Research proposal is putting post-quantum wallet security back in focus, outlining a practical way to verify quantu...