XRP Bull Flag Breakout Could Lead Price To $4, Analyst Says
An analyst has explained how XRP could end up traveling to the $4 level if its 4-hour price can break out of a recent bull flag pattern. XRP Has Been Consolidating Inside A Bull Flag Recently In a new post on X, analyst...
Archive context
Older archive item. Useful for background and entity history, but not a fresh market-moving signal.

An analyst has explained how XRP could end up traveling to the $4 level if its 4-hour price can break out of a recent bull flag pattern.
XRP Has Been Consolidating Inside A Bull Flag RecentlyIn a new post on X, analyst Ali Martinez has talked about how the 4-hour price of XRP has been forming a Bull Flag recently. The “Bull Flag” here refers to a pattern in technical analysis (TA) that, as its name suggests, looks like a flag on a pole.
The pattern forms whenever the asset’s price follows up a sharp uptrend with a period of consolidation towards the downside. The initial upwards move corresponds to the ‘pole,’ while the consolidation period makes up for the ‘flag.’
In flag patterns, this consolidation specifically happens inside a parallel channel. That is, between two parallel trendlines marking successive tops and bottoms in the price. When the trendlines are converging, the pattern is known as a pennant.
The upper level of the flag can be likely to provide resistance to the price, while the lower level may act as support. A break out of either of these trendlines can imply a continuation of trend in that direction.
A bull flag is considered to be a continuation pattern, so the probability of a breakout happening above the resistance level may be higher than that of the support line failing.
Like the bull flag, there is also a pattern called the bear flag. This one works much in the same way, except for the fact that the pole is made by a sharp move down and the flag represents a brief phase of consolidation towards the upside.
Now, here is the chart shared by the analyst that shows the bull flag that XRP has recently been traveling inside:
As displayed in the above graph, the 4-hour XRP price has just seen a rise to the upper level of the bull flag consolidation channel. When the same retest occurred a couple of days ago, the asset found rejection, but it’s possible that this might be the time it finds a break.
Martinez has pointed out, however, that the cryptocurrency has witnessed another signal alongside this retest: the completion of a Tom Demark (TD) Sequential sell setup.
The TD Sequential is a TA indicator that basically points out probable locations of tops and bottoms in any asset’s value. It involves two phases, with the first, which is known as the setup, occurring after price observes nine candles of the same color.
XRP has finished this type of TD Sequential phase with nine green candles, meaning that the indicator is now signaling a potential reversal to the downside for the coin.
As such, the analyst thinks a brief correction would happen for the cryptocurrency first, before it manages to find a break above the $0.246 resistance. Bull flag breakouts can be of a similar length as the pole, so based on this, Martinez has chosen the $4 target for XRP.
XRP PriceAt the time of writing, XRP is floating around $2.42, up more than 4% over the last seven days.
Why this matters
This altcoin story adds another data point to the current market tape and is useful when read alongside nearby source coverage.
Original source
Read on NewsBTCRelated market context

Dogecoin (DOGE) Price Prediction: DOGE Holds Near $0.084 as $0.09 Breakout Could Open $0.115
Dogecoin is back in the spotlight as price slips towards the $0.084 area, putting an important support zone under pressure. The la...

Bitcoin (BTC) Price Today: Whale Buying Strengthens Bullish Case as BTC Consolidates Near $79K
At the same time, technical indicators show that the recent rally has become stretched, leaving Bitcoin price caught between a con...

XRP Price Targets $2 as One Key Metric Flashes Bullish Signal
XRP price is sitting in a corrective pocket after one of its stronger months of the year. That $2 target sounds ambitious given th...

Bitcoin’s failed $81,000 breakout just put $75,000 back on the table
Bitcoin trades near $78,000 heading into the weekend, sitting almost between $77,000 support and $80,000 resistance after a sharp...

Bitcoin ETF Outflows Hit $201M As Inflow Streak Breaks
US spot Bitcoin ETFs recorded $201.9 million in net outflows for the August 28 session, ending a nine-day inflow streak and giving...
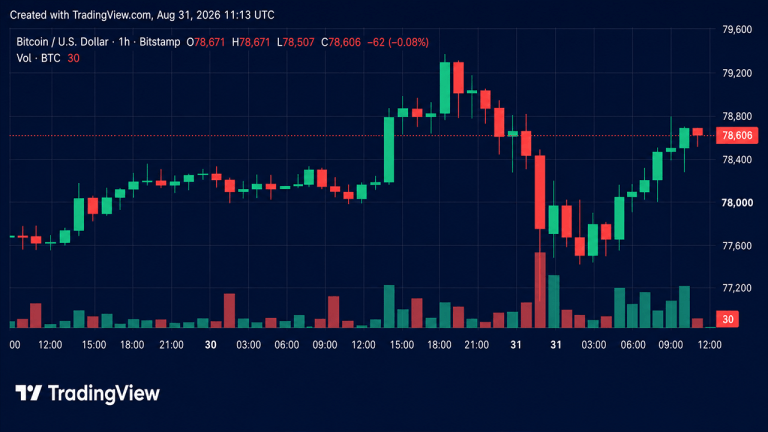
Bitcoin Price Battles Back From $77K as Bulls Eye $80K Breakout
Bitcoin is fighting to steady itself Monday, Aug. 31, 2026, after a hard rejection from the upper-$79,000 range flushed the leadin...