XRP Bulls Flex Muscles: Potential Uptrend in Play?
XRP price dipped but the bulls were active near the $0.4700 support. The price reclaimed the 100-hourly SMA and might continue to rise if it clears $0.4950. XRP price found support at $0.4700 and started a recovery wave....

XRP price dipped but the bulls were active near the $0.4700 support. The price reclaimed the 100-hourly SMA and might continue to rise if it clears $0.4950.
- XRP price found support at $0.4700 and started a recovery wave.
- The price is now trading above $0.4800 and the 100-hourly Simple Moving Average.
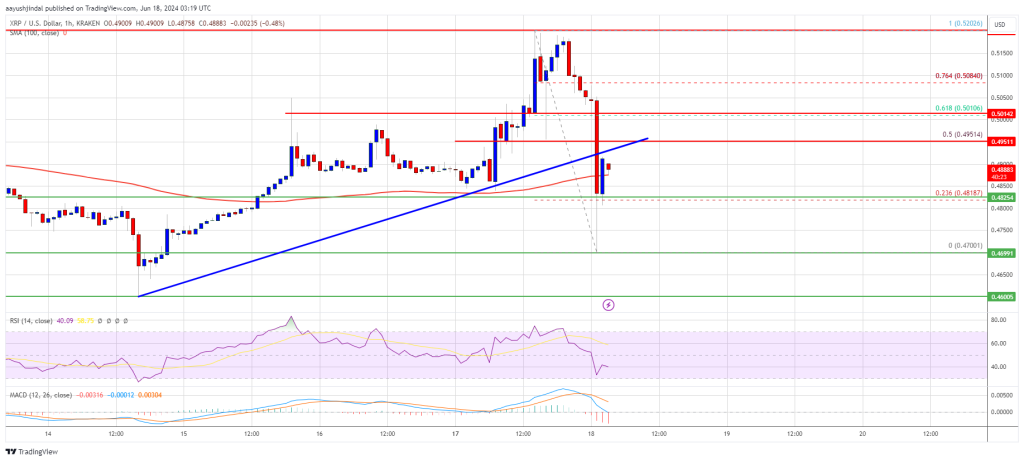
- There was a break below a major bullish trend line with support at $0.4915 on the hourly chart of the XRP/USD pair (data source from Kraken).
- The pair could continue to rise unless it fails to stay above the $0.4820 support zone.
XRP price failed to clear the $0.520 resistance and reacted to the downside like Bitcoin and Ethereum. There was a sharp decline below the $0.500 and $0.4850 support levels. There was a break below a major bullish trend line with support at $0.4915 on the hourly chart of the XRP/USD pair.
However, the bulls took a stand near $0.4700. The price started another upward move from the $0.4700 low. There was a move above the $0.4750 and $0.4820 resistance levels. The price even cleared the 23.6% Fib retracement level of the downward move from the $0.5202 swing high to the $0.4700 low.
The price is now trading above $0.4800 and the 100-hourly Simple Moving Average. On the upside, the price is facing resistance near the $0.4950 level and the 50% Fib retracement level of the downward move from the $0.5202 swing high to the $0.4700 low.
The first key resistance is near $0.500. The next major resistance is near the $0.520 level. A close above the $0.520 resistance zone could send the price higher. The next key resistance is near $0.5320. If there is a close above the $0.5320 resistance level, there could be a steady increase toward the $0.5500 resistance. Any more gains might send the price toward the $0.5550 resistance.
Another Decline?If XRP fails to clear the $0.4950 resistance zone, it could start another decline. Initial support on the downside is near the $0.4865 level and the 100-hourly Simple Moving Average.
The next major support is at $0.4820. If there is a downside break and a close below the $0.4820 level, the price might gain bearish momentum. In the stated case, the price could decline and retest the $0.4550 support in the near term.
Technical Indicators
Hourly MACD – The MACD for XRP/USD is now losing pace in the bearish zone.
Hourly RSI (Relative Strength Index) – The RSI for XRP/USD is now below the 50 level.
Major Support Levels – $0.4820 and $0.4700.
Major Resistance Levels – $0.4950 and $0.500.
Original source
Read on NewsBTCRelated market context

Uranium Holds Above $85 as Mining ETF Rebounds From June Sell-Off
The latest charts display that the market is divided into stable physical prices and uranium shares trying to regain momentum afte...

Standard Chartered Says Bitcoin Bottomed Near $59,000 As Crypto Winter Ends
TL;DR Standard Chartered’s Geoffrey Kendrick reportedly says Bitcoin’s $59,000 area marked the cycle bottom. The note cites SpaceX...

Bitcoin price faces new risk as big buyers lose conviction
Bitcoin’s largest buyers are no longer behaving like a reliable backstop for the largest cryptocurrency. The exchange-traded funds...

Elon Musk’s trillionaire status puts his net worth above crypto’s entire market cap outside Bitcoin
Elon Musk has become the first person in modern history to amass a personal net worth exceeding $1 trillion, crossing the historic...

Bitcoin price challenges $64,000 weekend wall – needing a breakout or risk a deeper correction
Bitcoin reclaimed $64,000 on June 12 and touched an intraday high of $64,301 in the same session that spot ETF flows finally flipp...

Bitcoin Mining Cost Model Points To $47,000 Floor, But Analysts Urge Caution
TL;DR Crypto Rover says Bitcoin has never bottomed below electrical production cost, currently estimated at $47,000. Mining-cost m...