XRP Bulls Lose Grip as Signals Point Toward Another Decline
XRP price started a steady increase above $2.220. The price is now struggling to clear $2.280 and might start a fresh decline below $2.150. XRP price started a fresh increase above the $2.20 zone. The price is now tradin...
XRP price started a steady increase above $2.220. The price is now struggling to clear $2.280 and might start a fresh decline below $2.150.
- XRP price started a fresh increase above the $2.20 zone.
- The price is now trading near $2.180 and the 100-hourly Simple Moving Average.
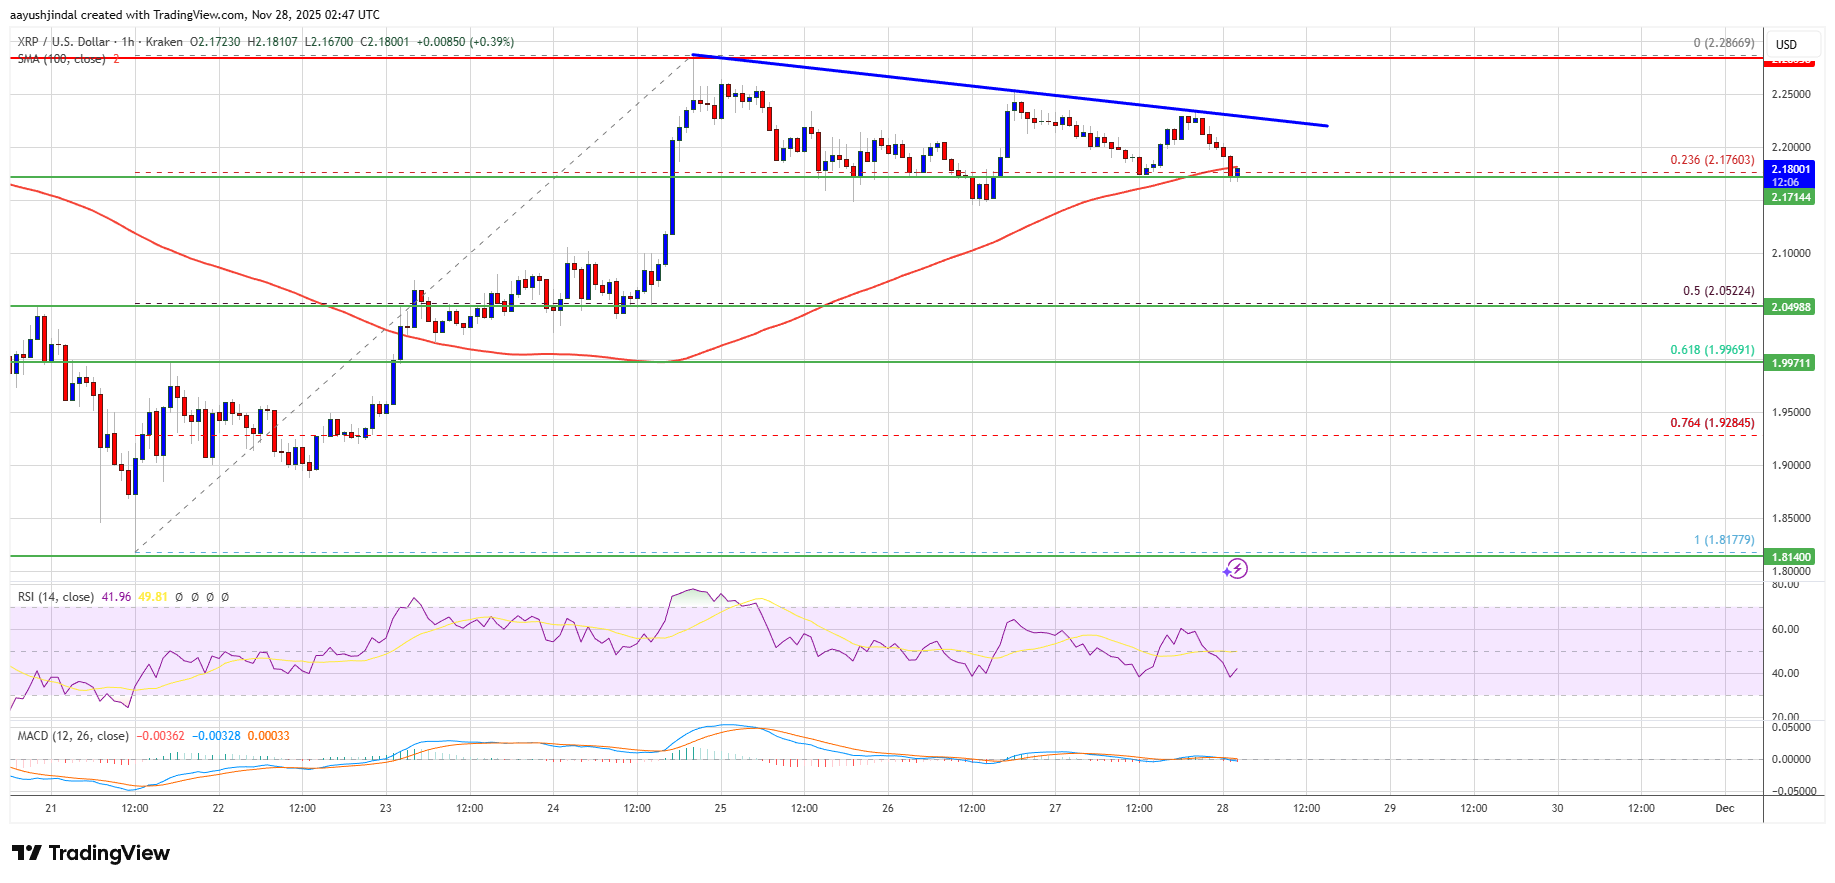
- There is a near bearish trend line forming with resistance at $2.2250 on the hourly chart of the XRP/USD pair (data source from Kraken).
- The pair could continue to move down if it dips below $2.150.
XRP price started a decent upward move above $2.120 and $2.150, like Bitcoin and Ethereum. The price gained pace for a clear move above the $2.20 resistance.
The bulls even pumped the price above the $2.240 zone. A high was formed at $2.286 and the price started a downside correction. There was a move below the 23.6% Fib retracement level of the upward move from the $1.817 swing low to the $2.286 high.
The price is now trading near $2.180 and the 100-hourly Simple Moving Average. Besides, there is a near bearish trend line forming with resistance at $2.2250 on the hourly chart of the XRP/USD pair.
If there is a fresh upward move, the price might face resistance near the $2.2250 level. The first major resistance is near the $2.250 level, above which the price could rise and test $2.2850. A clear move above the $2.2850 resistance might send the price toward the $2.350 resistance. Any more gains might send the price toward the $2.4320 resistance. The next major hurdle for the bulls might be near $2.50.
Downside Continuation?If XRP fails to clear the $2.250 resistance zone, it could start a fresh decline. Initial support on the downside is near the $2.150 level. The next major support is near the $2.10 level.
If there is a downside break and a close below the $2.10 level, the price might continue to decline toward $2.050 and the 50% Fib retracement level of the upward move from the $1.817 swing low to the $2.286 high. The next major support sits near the $2.00 zone, below which the price could continue lower toward $1.9250.
Technical Indicators
Hourly MACD – The MACD for XRP/USD is now losing pace in the bullish zone.
Hourly RSI (Relative Strength Index) – The RSI for XRP/USD is now below the 50 level.
Major Support Levels – $2.150 and $2.050.
Major Resistance Levels – $2.250 and $2.280.
Original source
Read on NewsBTCRelated market context

Ethereum Price Prediction: 3 Million ETH Rushes Into Staking as Sellers Vanish
Is nobody leaving Ethereum? A record 36 million ETH is now locked in staking, roughly 29–30% of the circulating supply, and the va...

Most Traders Will Scroll Past This Grok AI Bitcoin Predicts, Big Mistake
Elon Musk Grok AI just looked at a Bitcoin chart down more than 50% and predicts it’s a classic accumulation zone, targeting $150,...

XRP Price Prediction: Japan Regulates Crypto like Stocks, XRP to Benefit First
Japan just rewrote the rules. XRP price is battling below resistance at $1.10, but it’s prediction is getting bullish as Japan’s p...

The 3-Part Impulse That Shows Where The XRP Price Is Headed Next
XRP bulls are trying to turn a brutal selloff into something bigger than a relief bounce. An interesting setup shows a possible th...

XRP aims for $0.90 as ETF demand battles selling pressure from whales
XRP is trading at $1.11, down roughly 17% from its June opening, having set a new 2026 low on June 5 and shed $8 billion in market...

XRP Price Prediction: Japan XRP ETF Listing is Getting Closer
Japan just handed XRP bulls a major regulatory tailwind. XRP price is retesting a congestion zone, and the prediction could turn b...