XRP Bulls Target New Gains: Will They Achieve a Breakout?
XRP price dropped toward the $0.5550 level before the bulls appeared. The price is now consolidating and might aim for a fresh increase above $0.580. XRP price started a consolidation phase after a drop toward the $0.555...

XRP price dropped toward the $0.5550 level before the bulls appeared. The price is now consolidating and might aim for a fresh increase above $0.580.
- XRP price started a consolidation phase after a drop toward the $0.5550 zone.
- The price is now trading below $0.580 and the 100-hourly Simple Moving Average.
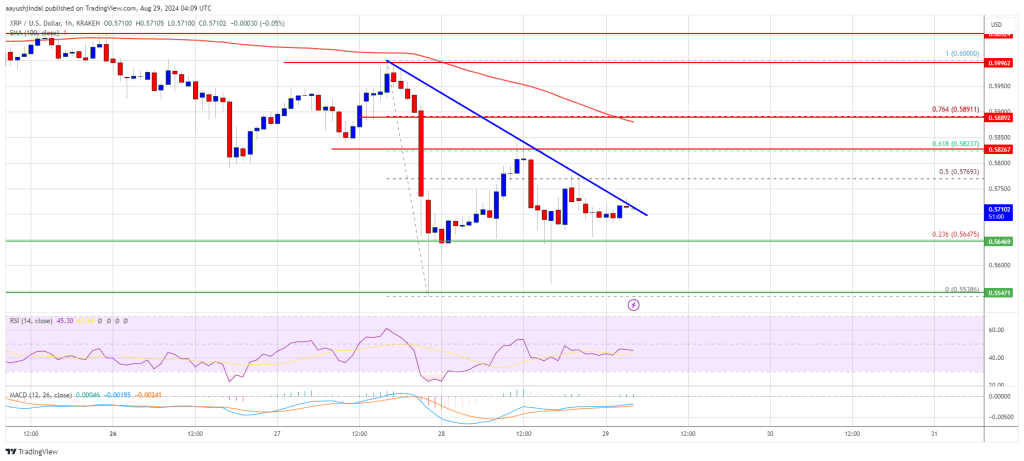
- There is a key bearish trend line forming with resistance at $0.5720 on the hourly chart of the XRP/USD pair (data source from Kraken).
- The pair could attempt a recovery wave if it clears the $0.580 resistance zone.
XRP price extended losses below the $0.580 level like Bitcoin and Ethereum. The price even tested the $0.5550 zone. A low was formed at $0.5538 and the price recently started an upside correction.
There was a move above the $0.5580 and $0.5620 levels. The price spiked above the 50% Fib retracement level of the downward move from the $0.60 swing high to the $0.5538 low. However, the bears remained active and protected more upsides above $0.5850.
The price is still trading below $0.580 and the 100-hourly Simple Moving Average. On the upside, the price might face resistance near the $0.5720 level. There is also a key bearish trend line forming with resistance at $0.5720 on the hourly chart of the XRP/USD pair.
The first major resistance is near the $0.5885 level. It is close to the 76.4% Fib retracement level of the downward move from the $0.60 swing high to the $0.5538 low.
The next key resistance could be $0.60. A clear move above the $0.60 resistance might send the price toward the $0.6050 resistance. The next major resistance is near the $0.6160 level. Any more gains might send the price toward the $0.6250 resistance or even $0.6320 in the near term.
Another Decline?If XRP fails to clear the $0.5720 resistance zone, it could start another decline. Initial support on the downside is near the $0.5640 level. The next major support is at $0.5550.
If there is a downside break and a close below the $0.5550 level, the price might continue to decline toward the $0.5320 support in the near term. The next major support sits at $0.5120.
Technical Indicators
Hourly MACD – The MACD for XRP/USD is now losing pace in the bearish zone.
Hourly RSI (Relative Strength Index) – The RSI for XRP/USD is now below the 50 level.
Major Support Levels – $0.5640 and $0.5550.
Major Resistance Levels – $0.5720 and $0.5885.
Original source
Read on NewsBTCRelated market context

Uranium Holds Above $85 as Mining ETF Rebounds From June Sell-Off
The latest charts display that the market is divided into stable physical prices and uranium shares trying to regain momentum afte...

Bitcoin price challenges $64,000 weekend wall – needing a breakout or risk a deeper correction
Bitcoin reclaimed $64,000 on June 12 and touched an intraday high of $64,301 in the same session that spot ETF flows finally flipp...

Bitcoin Mining Cost Model Points To $47,000 Floor, But Analysts Urge Caution
TL;DR Crypto Rover says Bitcoin has never bottomed below electrical production cost, currently estimated at $47,000. Mining-cost m...

Standard Chartered Says Bitcoin Bottomed Near $59,000 As Crypto Winter Ends
TL;DR Standard Chartered’s Geoffrey Kendrick reportedly says Bitcoin’s $59,000 area marked the cycle bottom. The note cites SpaceX...

Elon Musk’s trillionaire status puts his net worth above crypto’s entire market cap outside Bitcoin
Elon Musk has become the first person in modern history to amass a personal net worth exceeding $1 trillion, crossing the historic...

Google Gemini AI Predicts Jaw-Dropping XRP Price For Next 90 Days
Google Gemini AI just put XRP back under the spotlight, predicting it is tightly wound for a major breakout toward $1.60 to $1.80...